Afghan vs Mexican American Indian Master's Degree
COMPARE
Afghan
Mexican American Indian
Master's Degree
Master's Degree Comparison
Afghans
Mexican American Indians
16.5%
MASTER'S DEGREE
96.2/ 100
METRIC RATING
121st/ 347
METRIC RANK
11.2%
MASTER'S DEGREE
0.0/ 100
METRIC RATING
306th/ 347
METRIC RANK
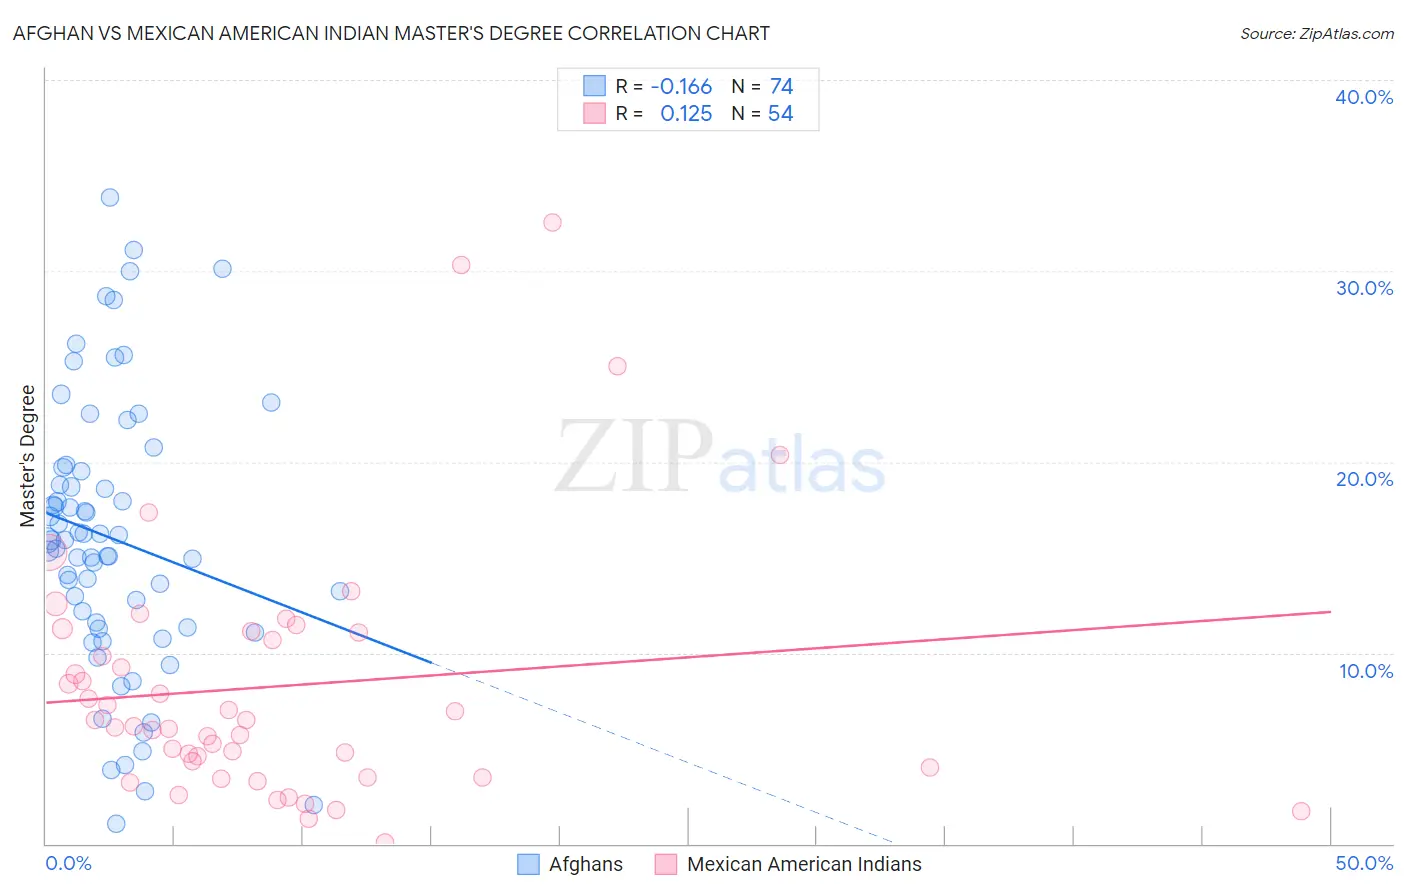
Afghan vs Mexican American Indian Master's Degree Correlation Chart
The statistical analysis conducted on geographies consisting of 148,857,027 people shows a poor negative correlation between the proportion of Afghans and percentage of population with at least master's degree education in the United States with a correlation coefficient (R) of -0.166 and weighted average of 16.5%. Similarly, the statistical analysis conducted on geographies consisting of 317,480,404 people shows a poor positive correlation between the proportion of Mexican American Indians and percentage of population with at least master's degree education in the United States with a correlation coefficient (R) of 0.125 and weighted average of 11.2%, a difference of 46.4%.
Master's Degree Correlation Summary
| Measurement | Afghan | Mexican American Indian |
| Minimum | 1.0% | 0.093% |
| Maximum | 33.8% | 32.5% |
| Range | 32.8% | 32.4% |
| Mean | 16.0% | 8.2% |
| Median | 15.9% | 6.3% |
| Interquartile 25% (IQ1) | 11.3% | 4.0% |
| Interquartile 75% (IQ3) | 19.5% | 11.1% |
| Interquartile Range (IQR) | 8.2% | 7.1% |
| Standard Deviation (Sample) | 7.1% | 6.7% |
| Standard Deviation (Population) | 7.1% | 6.6% |
Similar Demographics by Master's Degree
Demographics Similar to Afghans by Master's Degree
In terms of master's degree, the demographic groups most similar to Afghans are Lebanese (16.5%, a difference of 0.20%), Jordanian (16.5%, a difference of 0.30%), British (16.4%, a difference of 0.43%), Croatian (16.4%, a difference of 0.44%), and Immigrants from Eritrea (16.4%, a difference of 0.52%).
| Demographics | Rating | Rank | Master's Degree |
| Northern Europeans | 97.6 /100 | #114 | Exceptional 16.7% |
| Immigrants | Uganda | 97.3 /100 | #115 | Exceptional 16.6% |
| Immigrants | Southern Europe | 97.2 /100 | #116 | Exceptional 16.6% |
| Immigrants | Moldova | 97.2 /100 | #117 | Exceptional 16.6% |
| Brazilians | 96.8 /100 | #118 | Exceptional 16.5% |
| Jordanians | 96.5 /100 | #119 | Exceptional 16.5% |
| Lebanese | 96.4 /100 | #120 | Exceptional 16.5% |
| Afghans | 96.2 /100 | #121 | Exceptional 16.5% |
| British | 95.6 /100 | #122 | Exceptional 16.4% |
| Croatians | 95.6 /100 | #123 | Exceptional 16.4% |
| Immigrants | Eritrea | 95.5 /100 | #124 | Exceptional 16.4% |
| Italians | 95.4 /100 | #125 | Exceptional 16.4% |
| Immigrants | Eastern Africa | 95.2 /100 | #126 | Exceptional 16.3% |
| Palestinians | 94.8 /100 | #127 | Exceptional 16.3% |
| Immigrants | Sierra Leone | 94.7 /100 | #128 | Exceptional 16.3% |
Demographics Similar to Mexican American Indians by Master's Degree
In terms of master's degree, the demographic groups most similar to Mexican American Indians are Cheyenne (11.2%, a difference of 0.15%), Immigrants from Latin America (11.3%, a difference of 0.19%), Puerto Rican (11.2%, a difference of 0.70%), Immigrants from Cabo Verde (11.3%, a difference of 0.84%), and Puget Sound Salish (11.1%, a difference of 0.99%).
| Demographics | Rating | Rank | Master's Degree |
| Chickasaw | 0.1 /100 | #299 | Tragic 11.4% |
| Chippewa | 0.1 /100 | #300 | Tragic 11.4% |
| Tsimshian | 0.1 /100 | #301 | Tragic 11.4% |
| Cherokee | 0.1 /100 | #302 | Tragic 11.4% |
| Immigrants | Laos | 0.1 /100 | #303 | Tragic 11.4% |
| Immigrants | Cabo Verde | 0.1 /100 | #304 | Tragic 11.3% |
| Immigrants | Latin America | 0.0 /100 | #305 | Tragic 11.3% |
| Mexican American Indians | 0.0 /100 | #306 | Tragic 11.2% |
| Cheyenne | 0.0 /100 | #307 | Tragic 11.2% |
| Puerto Ricans | 0.0 /100 | #308 | Tragic 11.2% |
| Puget Sound Salish | 0.0 /100 | #309 | Tragic 11.1% |
| Shoshone | 0.0 /100 | #310 | Tragic 11.1% |
| Seminole | 0.0 /100 | #311 | Tragic 11.0% |
| Choctaw | 0.0 /100 | #312 | Tragic 11.0% |
| Yaqui | 0.0 /100 | #313 | Tragic 11.0% |