Immigrants from Portugal vs Soviet Union 10th Grade
COMPARE
Immigrants from Portugal
Soviet Union
10th Grade
10th Grade Comparison
Immigrants from Portugal
Soviet Union
90.8%
10TH GRADE
0.0/ 100
METRIC RATING
312th/ 347
METRIC RANK
94.6%
10TH GRADE
98.3/ 100
METRIC RATING
93rd/ 347
METRIC RANK
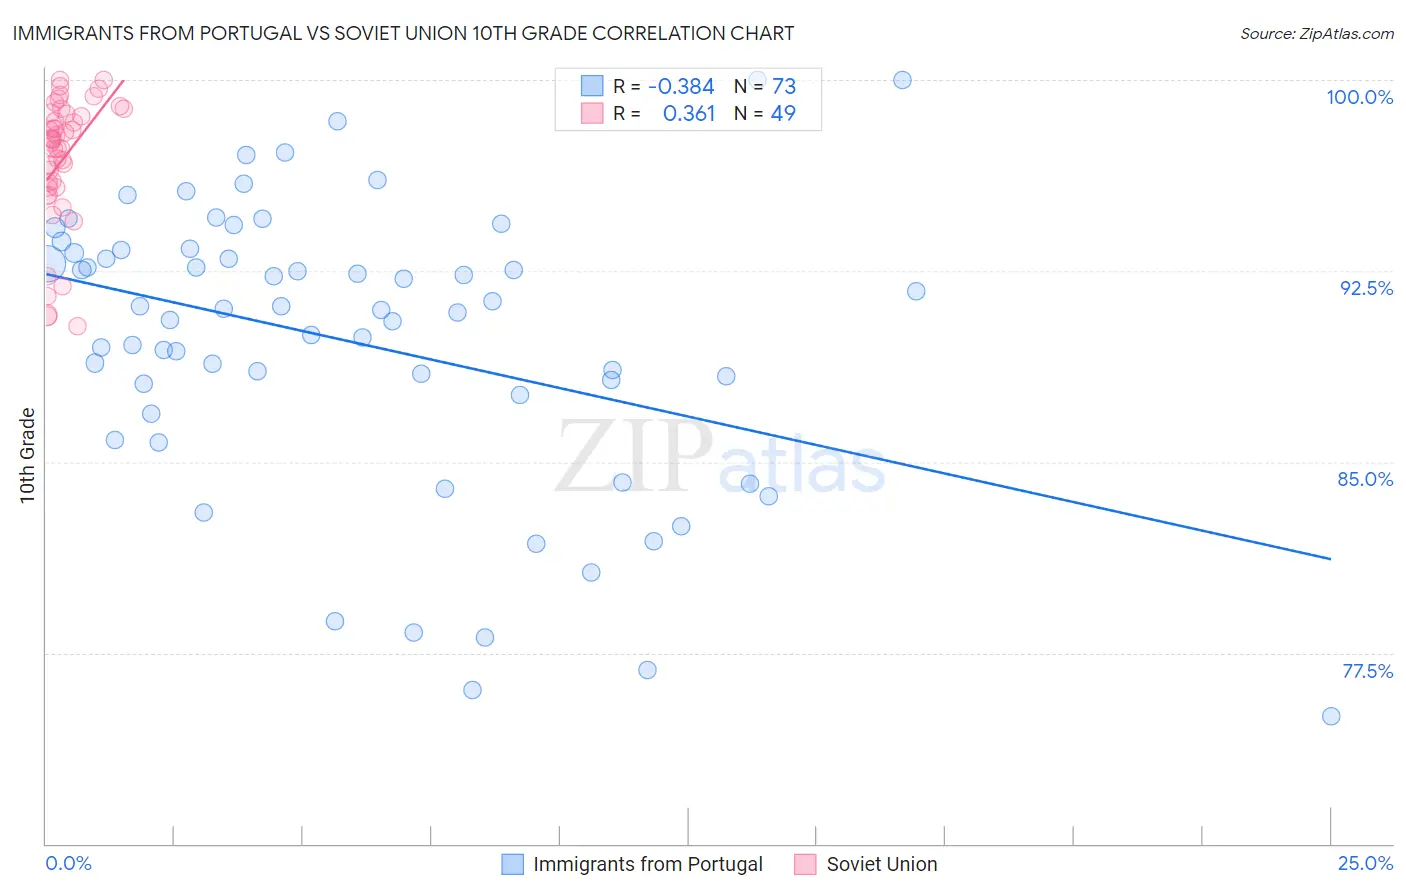
Immigrants from Portugal vs Soviet Union 10th Grade Correlation Chart
The statistical analysis conducted on geographies consisting of 174,792,107 people shows a mild negative correlation between the proportion of Immigrants from Portugal and percentage of population with at least 10th grade education in the United States with a correlation coefficient (R) of -0.384 and weighted average of 90.8%. Similarly, the statistical analysis conducted on geographies consisting of 43,454,395 people shows a mild positive correlation between the proportion of Soviet Union and percentage of population with at least 10th grade education in the United States with a correlation coefficient (R) of 0.361 and weighted average of 94.6%, a difference of 4.2%.
10th Grade Correlation Summary
| Measurement | Immigrants from Portugal | Soviet Union |
| Minimum | 75.0% | 90.4% |
| Maximum | 100.0% | 100.0% |
| Range | 25.0% | 9.6% |
| Mean | 89.7% | 96.9% |
| Median | 91.0% | 97.7% |
| Interquartile 25% (IQ1) | 87.3% | 95.8% |
| Interquartile 75% (IQ3) | 93.3% | 98.7% |
| Interquartile Range (IQR) | 6.0% | 2.9% |
| Standard Deviation (Sample) | 5.6% | 2.5% |
| Standard Deviation (Population) | 5.6% | 2.5% |
Similar Demographics by 10th Grade
Demographics Similar to Immigrants from Portugal by 10th Grade
In terms of 10th grade, the demographic groups most similar to Immigrants from Portugal are Cape Verdean (90.8%, a difference of 0.030%), Nepalese (90.7%, a difference of 0.11%), Immigrants from Cambodia (90.9%, a difference of 0.16%), Vietnamese (90.9%, a difference of 0.19%), and Immigrants from Caribbean (90.6%, a difference of 0.19%).
| Demographics | Rating | Rank | 10th Grade |
| Immigrants | Dominica | 0.0 /100 | #305 | Tragic 91.1% |
| Yaqui | 0.0 /100 | #306 | Tragic 91.1% |
| Immigrants | Fiji | 0.0 /100 | #307 | Tragic 91.0% |
| Immigrants | Bangladesh | 0.0 /100 | #308 | Tragic 91.0% |
| Immigrants | Immigrants | 0.0 /100 | #309 | Tragic 91.0% |
| Vietnamese | 0.0 /100 | #310 | Tragic 90.9% |
| Immigrants | Cambodia | 0.0 /100 | #311 | Tragic 90.9% |
| Immigrants | Portugal | 0.0 /100 | #312 | Tragic 90.8% |
| Cape Verdeans | 0.0 /100 | #313 | Tragic 90.8% |
| Nepalese | 0.0 /100 | #314 | Tragic 90.7% |
| Immigrants | Caribbean | 0.0 /100 | #315 | Tragic 90.6% |
| Ecuadorians | 0.0 /100 | #316 | Tragic 90.6% |
| Immigrants | Ecuador | 0.0 /100 | #317 | Tragic 90.4% |
| Immigrants | Cuba | 0.0 /100 | #318 | Tragic 90.2% |
| Nicaraguans | 0.0 /100 | #319 | Tragic 90.2% |
Demographics Similar to Soviet Union by 10th Grade
In terms of 10th grade, the demographic groups most similar to Soviet Union are Immigrants from Germany (94.6%, a difference of 0.0%), Yugoslavian (94.6%, a difference of 0.010%), Menominee (94.6%, a difference of 0.010%), Immigrants from Switzerland (94.6%, a difference of 0.010%), and Lebanese (94.6%, a difference of 0.010%).
| Demographics | Rating | Rank | 10th Grade |
| Puget Sound Salish | 99.0 /100 | #86 | Exceptional 94.7% |
| Immigrants | Saudi Arabia | 99.0 /100 | #87 | Exceptional 94.7% |
| Immigrants | Japan | 99.0 /100 | #88 | Exceptional 94.7% |
| Immigrants | Moldova | 98.9 /100 | #89 | Exceptional 94.7% |
| South Africans | 98.8 /100 | #90 | Exceptional 94.7% |
| Whites/Caucasians | 98.8 /100 | #91 | Exceptional 94.7% |
| Yugoslavians | 98.4 /100 | #92 | Exceptional 94.6% |
| Soviet Union | 98.3 /100 | #93 | Exceptional 94.6% |
| Immigrants | Germany | 98.3 /100 | #94 | Exceptional 94.6% |
| Menominee | 98.3 /100 | #95 | Exceptional 94.6% |
| Immigrants | Switzerland | 98.3 /100 | #96 | Exceptional 94.6% |
| Lebanese | 98.3 /100 | #97 | Exceptional 94.6% |
| Immigrants | Bulgaria | 98.1 /100 | #98 | Exceptional 94.6% |
| Immigrants | France | 97.9 /100 | #99 | Exceptional 94.5% |
| Immigrants | South Central Asia | 97.8 /100 | #100 | Exceptional 94.5% |