Aleut vs Immigrants from Europe 10th Grade
COMPARE
Aleut
Immigrants from Europe
10th Grade
10th Grade Comparison
Aleuts
Immigrants from Europe
95.0%
10TH GRADE
99.8/ 100
METRIC RATING
58th/ 347
METRIC RANK
94.5%
10TH GRADE
97.5/ 100
METRIC RATING
103rd/ 347
METRIC RANK
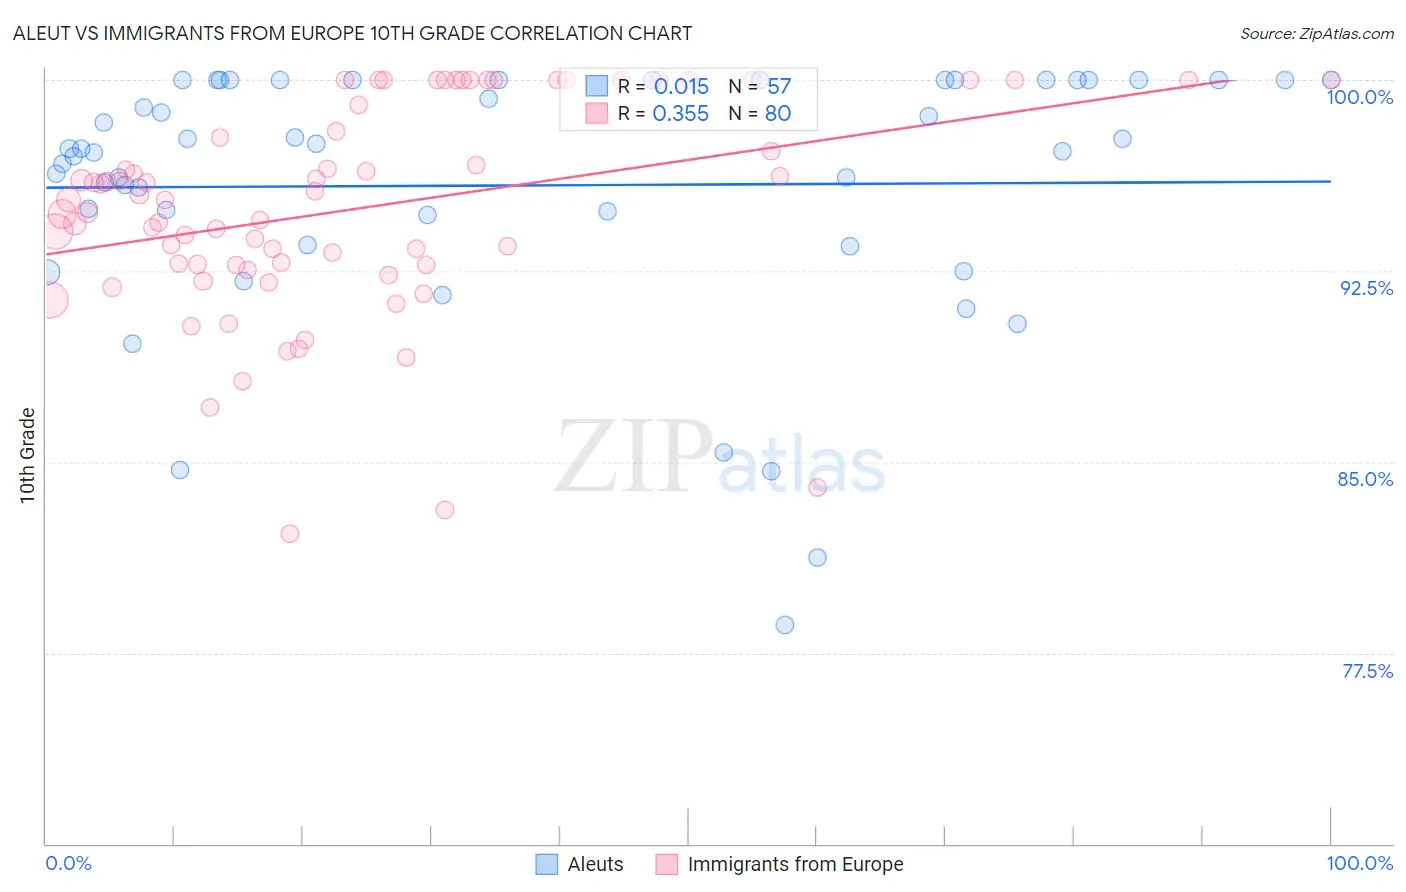
Aleut vs Immigrants from Europe 10th Grade Correlation Chart
The statistical analysis conducted on geographies consisting of 61,782,736 people shows no correlation between the proportion of Aleuts and percentage of population with at least 10th grade education in the United States with a correlation coefficient (R) of 0.015 and weighted average of 95.0%. Similarly, the statistical analysis conducted on geographies consisting of 547,425,973 people shows a mild positive correlation between the proportion of Immigrants from Europe and percentage of population with at least 10th grade education in the United States with a correlation coefficient (R) of 0.355 and weighted average of 94.5%, a difference of 0.55%.
10th Grade Correlation Summary
| Measurement | Aleut | Immigrants from Europe |
| Minimum | 78.6% | 82.2% |
| Maximum | 100.0% | 100.0% |
| Range | 21.4% | 17.8% |
| Mean | 95.9% | 95.0% |
| Median | 97.3% | 95.3% |
| Interquartile 25% (IQ1) | 94.1% | 92.7% |
| Interquartile 75% (IQ3) | 100.0% | 99.5% |
| Interquartile Range (IQR) | 5.9% | 6.8% |
| Standard Deviation (Sample) | 5.0% | 4.2% |
| Standard Deviation (Population) | 5.0% | 4.2% |
Similar Demographics by 10th Grade
Demographics Similar to Aleuts by 10th Grade
In terms of 10th grade, the demographic groups most similar to Aleuts are Ukrainian (95.0%, a difference of 0.0%), Celtic (95.0%, a difference of 0.0%), Immigrants from Ireland (95.0%, a difference of 0.010%), New Zealander (95.0%, a difference of 0.010%), and Cypriot (95.0%, a difference of 0.010%).
| Demographics | Rating | Rank | 10th Grade |
| Austrians | 99.8 /100 | #51 | Exceptional 95.1% |
| Ottawa | 99.8 /100 | #52 | Exceptional 95.1% |
| Immigrants | North America | 99.8 /100 | #53 | Exceptional 95.0% |
| Immigrants | Lithuania | 99.8 /100 | #54 | Exceptional 95.0% |
| Immigrants | Ireland | 99.8 /100 | #55 | Exceptional 95.0% |
| New Zealanders | 99.8 /100 | #56 | Exceptional 95.0% |
| Ukrainians | 99.8 /100 | #57 | Exceptional 95.0% |
| Aleuts | 99.8 /100 | #58 | Exceptional 95.0% |
| Celtics | 99.8 /100 | #59 | Exceptional 95.0% |
| Cypriots | 99.8 /100 | #60 | Exceptional 95.0% |
| Chippewa | 99.8 /100 | #61 | Exceptional 95.0% |
| Thais | 99.8 /100 | #62 | Exceptional 95.0% |
| Immigrants | Singapore | 99.8 /100 | #63 | Exceptional 95.0% |
| Native Hawaiians | 99.7 /100 | #64 | Exceptional 95.0% |
| Turks | 99.7 /100 | #65 | Exceptional 95.0% |
Demographics Similar to Immigrants from Europe by 10th Grade
In terms of 10th grade, the demographic groups most similar to Immigrants from Europe are Immigrants from Romania (94.5%, a difference of 0.0%), Immigrants from Turkey (94.5%, a difference of 0.010%), Immigrants from Serbia (94.5%, a difference of 0.010%), Immigrants from Croatia (94.5%, a difference of 0.010%), and Syrian (94.5%, a difference of 0.020%).
| Demographics | Rating | Rank | 10th Grade |
| Immigrants | Switzerland | 98.3 /100 | #96 | Exceptional 94.6% |
| Lebanese | 98.3 /100 | #97 | Exceptional 94.6% |
| Immigrants | Bulgaria | 98.1 /100 | #98 | Exceptional 94.6% |
| Immigrants | France | 97.9 /100 | #99 | Exceptional 94.5% |
| Immigrants | South Central Asia | 97.8 /100 | #100 | Exceptional 94.5% |
| Syrians | 97.7 /100 | #101 | Exceptional 94.5% |
| Cambodians | 97.6 /100 | #102 | Exceptional 94.5% |
| Immigrants | Europe | 97.5 /100 | #103 | Exceptional 94.5% |
| Immigrants | Romania | 97.5 /100 | #104 | Exceptional 94.5% |
| Immigrants | Turkey | 97.4 /100 | #105 | Exceptional 94.5% |
| Immigrants | Serbia | 97.4 /100 | #106 | Exceptional 94.5% |
| Immigrants | Croatia | 97.4 /100 | #107 | Exceptional 94.5% |
| Immigrants | North Macedonia | 97.2 /100 | #108 | Exceptional 94.5% |
| Immigrants | Norway | 97.2 /100 | #109 | Exceptional 94.5% |
| Burmese | 97.1 /100 | #110 | Exceptional 94.5% |