Alaska Native vs Immigrants from Europe 10th Grade
COMPARE
Alaska Native
Immigrants from Europe
10th Grade
10th Grade Comparison
Alaska Natives
Immigrants from Europe
94.9%
10TH GRADE
99.6/ 100
METRIC RATING
71st/ 347
METRIC RANK
94.5%
10TH GRADE
97.5/ 100
METRIC RATING
103rd/ 347
METRIC RANK
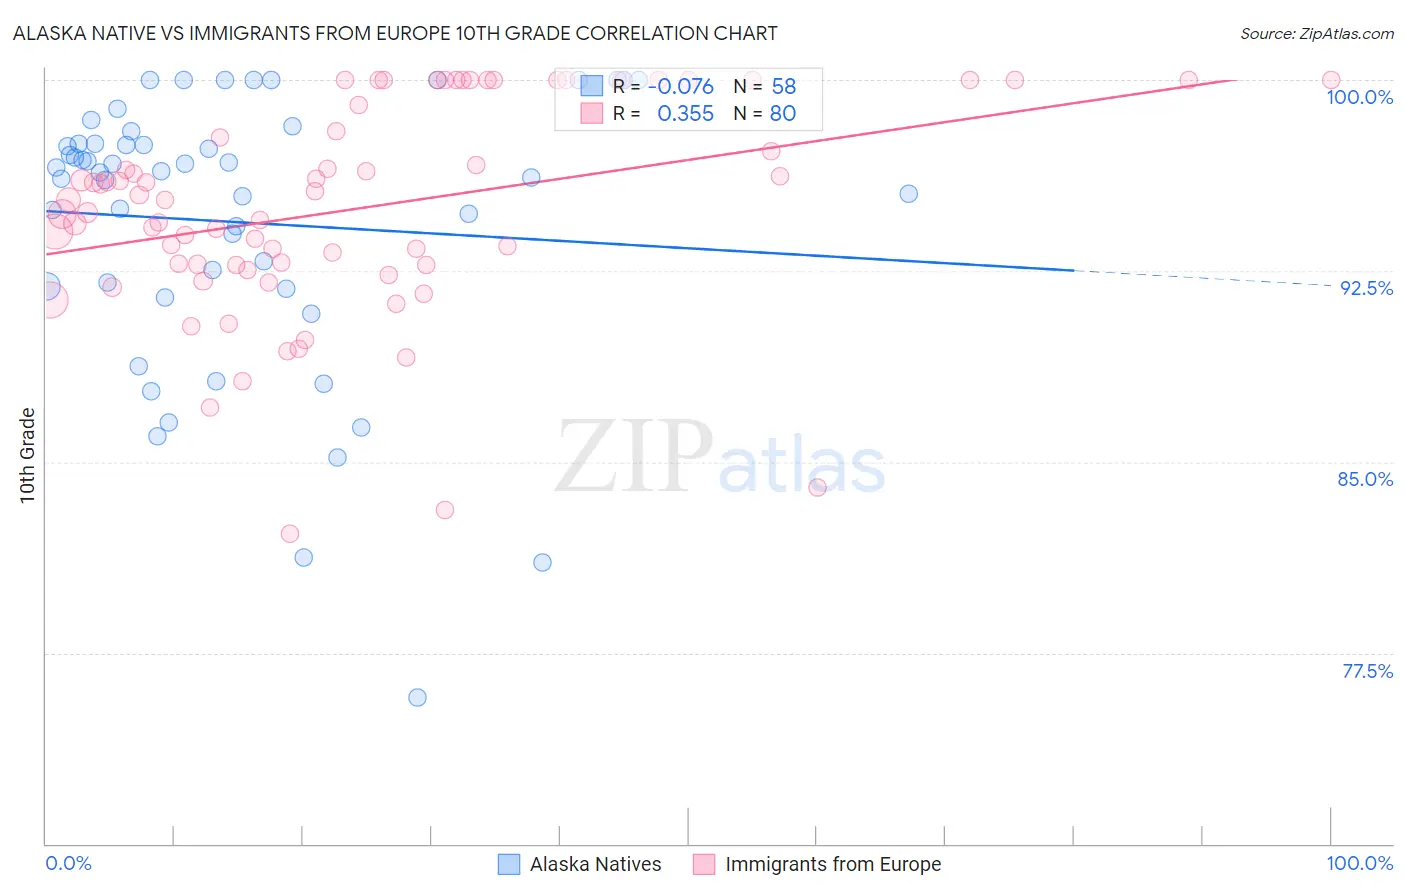
Alaska Native vs Immigrants from Europe 10th Grade Correlation Chart
The statistical analysis conducted on geographies consisting of 76,778,743 people shows a slight negative correlation between the proportion of Alaska Natives and percentage of population with at least 10th grade education in the United States with a correlation coefficient (R) of -0.076 and weighted average of 94.9%. Similarly, the statistical analysis conducted on geographies consisting of 547,425,973 people shows a mild positive correlation between the proportion of Immigrants from Europe and percentage of population with at least 10th grade education in the United States with a correlation coefficient (R) of 0.355 and weighted average of 94.5%, a difference of 0.42%.
10th Grade Correlation Summary
| Measurement | Alaska Native | Immigrants from Europe |
| Minimum | 75.7% | 82.2% |
| Maximum | 100.0% | 100.0% |
| Range | 24.3% | 17.8% |
| Mean | 94.4% | 95.0% |
| Median | 96.4% | 95.3% |
| Interquartile 25% (IQ1) | 91.9% | 92.7% |
| Interquartile 75% (IQ3) | 97.5% | 99.5% |
| Interquartile Range (IQR) | 5.6% | 6.8% |
| Standard Deviation (Sample) | 5.4% | 4.2% |
| Standard Deviation (Population) | 5.4% | 4.2% |
Similar Demographics by 10th Grade
Demographics Similar to Alaska Natives by 10th Grade
In terms of 10th grade, the demographic groups most similar to Alaska Natives are Zimbabwean (94.9%, a difference of 0.0%), Immigrants from England (94.9%, a difference of 0.010%), Immigrants from Sweden (94.9%, a difference of 0.020%), Bhutanese (94.9%, a difference of 0.020%), and Canadian (94.9%, a difference of 0.020%).
| Demographics | Rating | Rank | 10th Grade |
| Native Hawaiians | 99.7 /100 | #64 | Exceptional 95.0% |
| Turks | 99.7 /100 | #65 | Exceptional 95.0% |
| Immigrants | Australia | 99.7 /100 | #66 | Exceptional 94.9% |
| Immigrants | Netherlands | 99.7 /100 | #67 | Exceptional 94.9% |
| Immigrants | Belgium | 99.7 /100 | #68 | Exceptional 94.9% |
| Immigrants | England | 99.6 /100 | #69 | Exceptional 94.9% |
| Zimbabweans | 99.6 /100 | #70 | Exceptional 94.9% |
| Alaska Natives | 99.6 /100 | #71 | Exceptional 94.9% |
| Immigrants | Sweden | 99.6 /100 | #72 | Exceptional 94.9% |
| Bhutanese | 99.6 /100 | #73 | Exceptional 94.9% |
| Canadians | 99.6 /100 | #74 | Exceptional 94.9% |
| Okinawans | 99.5 /100 | #75 | Exceptional 94.8% |
| Romanians | 99.5 /100 | #76 | Exceptional 94.8% |
| Immigrants | South Africa | 99.5 /100 | #77 | Exceptional 94.8% |
| Filipinos | 99.3 /100 | #78 | Exceptional 94.8% |
Demographics Similar to Immigrants from Europe by 10th Grade
In terms of 10th grade, the demographic groups most similar to Immigrants from Europe are Immigrants from Romania (94.5%, a difference of 0.0%), Immigrants from Turkey (94.5%, a difference of 0.010%), Immigrants from Serbia (94.5%, a difference of 0.010%), Immigrants from Croatia (94.5%, a difference of 0.010%), and Syrian (94.5%, a difference of 0.020%).
| Demographics | Rating | Rank | 10th Grade |
| Immigrants | Switzerland | 98.3 /100 | #96 | Exceptional 94.6% |
| Lebanese | 98.3 /100 | #97 | Exceptional 94.6% |
| Immigrants | Bulgaria | 98.1 /100 | #98 | Exceptional 94.6% |
| Immigrants | France | 97.9 /100 | #99 | Exceptional 94.5% |
| Immigrants | South Central Asia | 97.8 /100 | #100 | Exceptional 94.5% |
| Syrians | 97.7 /100 | #101 | Exceptional 94.5% |
| Cambodians | 97.6 /100 | #102 | Exceptional 94.5% |
| Immigrants | Europe | 97.5 /100 | #103 | Exceptional 94.5% |
| Immigrants | Romania | 97.5 /100 | #104 | Exceptional 94.5% |
| Immigrants | Turkey | 97.4 /100 | #105 | Exceptional 94.5% |
| Immigrants | Serbia | 97.4 /100 | #106 | Exceptional 94.5% |
| Immigrants | Croatia | 97.4 /100 | #107 | Exceptional 94.5% |
| Immigrants | North Macedonia | 97.2 /100 | #108 | Exceptional 94.5% |
| Immigrants | Norway | 97.2 /100 | #109 | Exceptional 94.5% |
| Burmese | 97.1 /100 | #110 | Exceptional 94.5% |