Zimbabwean vs Korean Hearing Disability
COMPARE
Zimbabwean
Korean
Hearing Disability
Hearing Disability Comparison
Zimbabweans
Koreans
2.8%
HEARING DISABILITY
89.9/ 100
METRIC RATING
118th/ 347
METRIC RANK
3.1%
HEARING DISABILITY
27.6/ 100
METRIC RATING
192nd/ 347
METRIC RANK
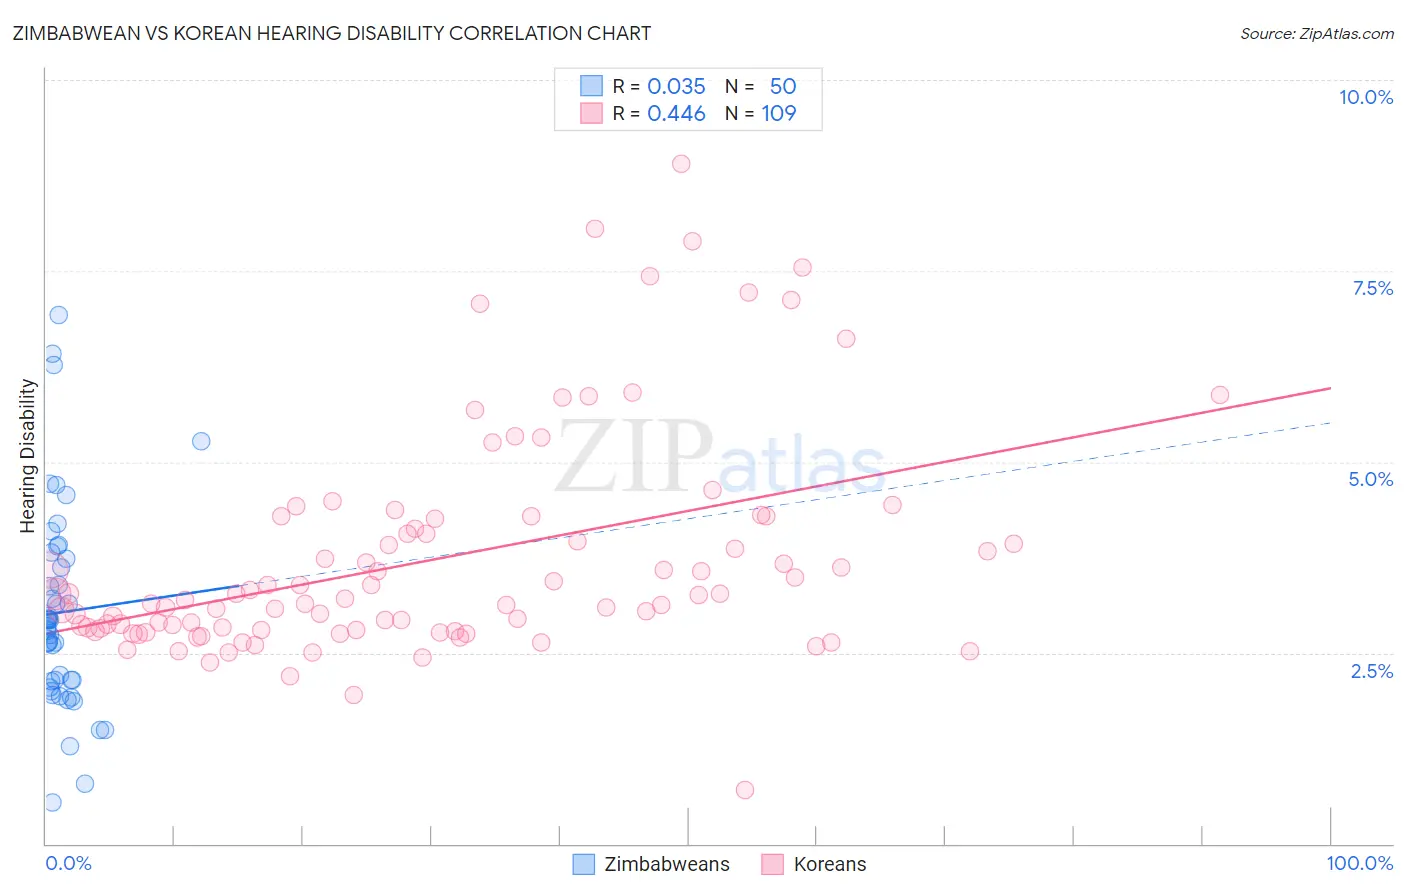
Zimbabwean vs Korean Hearing Disability Correlation Chart
The statistical analysis conducted on geographies consisting of 69,200,821 people shows no correlation between the proportion of Zimbabweans and percentage of population with hearing disability in the United States with a correlation coefficient (R) of 0.035 and weighted average of 2.8%. Similarly, the statistical analysis conducted on geographies consisting of 510,543,353 people shows a moderate positive correlation between the proportion of Koreans and percentage of population with hearing disability in the United States with a correlation coefficient (R) of 0.446 and weighted average of 3.1%, a difference of 7.8%.
Hearing Disability Correlation Summary
| Measurement | Zimbabwean | Korean |
| Minimum | 0.53% | 0.70% |
| Maximum | 6.9% | 8.9% |
| Range | 6.4% | 8.2% |
| Mean | 3.0% | 3.7% |
| Median | 2.9% | 3.2% |
| Interquartile 25% (IQ1) | 2.1% | 2.8% |
| Interquartile 75% (IQ3) | 3.7% | 4.2% |
| Interquartile Range (IQR) | 1.6% | 1.4% |
| Standard Deviation (Sample) | 1.3% | 1.5% |
| Standard Deviation (Population) | 1.3% | 1.5% |
Similar Demographics by Hearing Disability
Demographics Similar to Zimbabweans by Hearing Disability
In terms of hearing disability, the demographic groups most similar to Zimbabweans are Immigrants from Liberia (2.8%, a difference of 0.010%), Kenyan (2.8%, a difference of 0.020%), Immigrants (2.8%, a difference of 0.10%), Jordanian (2.8%, a difference of 0.11%), and Cuban (2.8%, a difference of 0.14%).
| Demographics | Rating | Rank | Hearing Disability |
| Immigrants | Yemen | 92.7 /100 | #111 | Exceptional 2.8% |
| U.S. Virgin Islanders | 92.5 /100 | #112 | Exceptional 2.8% |
| Immigrants | Belarus | 91.6 /100 | #113 | Exceptional 2.8% |
| Cambodians | 91.1 /100 | #114 | Exceptional 2.8% |
| Immigrants | Latin America | 90.5 /100 | #115 | Exceptional 2.8% |
| Immigrants | Immigrants | 90.3 /100 | #116 | Exceptional 2.8% |
| Immigrants | Liberia | 90.0 /100 | #117 | Excellent 2.8% |
| Zimbabweans | 89.9 /100 | #118 | Excellent 2.8% |
| Kenyans | 89.8 /100 | #119 | Excellent 2.8% |
| Jordanians | 89.5 /100 | #120 | Excellent 2.8% |
| Cubans | 89.4 /100 | #121 | Excellent 2.8% |
| Liberians | 89.0 /100 | #122 | Excellent 2.8% |
| Immigrants | Zaire | 88.6 /100 | #123 | Excellent 2.9% |
| Bahamians | 88.6 /100 | #124 | Excellent 2.9% |
| Immigrants | Albania | 88.5 /100 | #125 | Excellent 2.9% |
Demographics Similar to Koreans by Hearing Disability
In terms of hearing disability, the demographic groups most similar to Koreans are Macedonian (3.1%, a difference of 0.080%), Immigrants from Switzerland (3.1%, a difference of 0.13%), South African (3.1%, a difference of 0.37%), Immigrants from South Africa (3.1%, a difference of 0.38%), and Spanish American Indian (3.1%, a difference of 0.42%).
| Demographics | Rating | Rank | Hearing Disability |
| Immigrants | Southern Europe | 35.3 /100 | #185 | Fair 3.0% |
| Immigrants | Mexico | 34.9 /100 | #186 | Fair 3.0% |
| Blacks/African Americans | 34.7 /100 | #187 | Fair 3.0% |
| Mexican American Indians | 34.7 /100 | #188 | Fair 3.0% |
| Africans | 32.9 /100 | #189 | Fair 3.0% |
| Immigrants | South Africa | 31.1 /100 | #190 | Fair 3.1% |
| Immigrants | Switzerland | 28.8 /100 | #191 | Fair 3.1% |
| Koreans | 27.6 /100 | #192 | Fair 3.1% |
| Macedonians | 27.0 /100 | #193 | Fair 3.1% |
| South Africans | 24.5 /100 | #194 | Fair 3.1% |
| Spanish American Indians | 24.1 /100 | #195 | Fair 3.1% |
| Immigrants | Europe | 22.9 /100 | #196 | Fair 3.1% |
| Immigrants | Bosnia and Herzegovina | 20.6 /100 | #197 | Fair 3.1% |
| Immigrants | Croatia | 20.5 /100 | #198 | Fair 3.1% |
| Syrians | 19.2 /100 | #199 | Poor 3.1% |