Immigrants from Poland vs Korean Hearing Disability
COMPARE
Immigrants from Poland
Korean
Hearing Disability
Hearing Disability Comparison
Immigrants from Poland
Koreans
2.9%
HEARING DISABILITY
70.2/ 100
METRIC RATING
156th/ 347
METRIC RANK
3.1%
HEARING DISABILITY
27.6/ 100
METRIC RATING
192nd/ 347
METRIC RANK
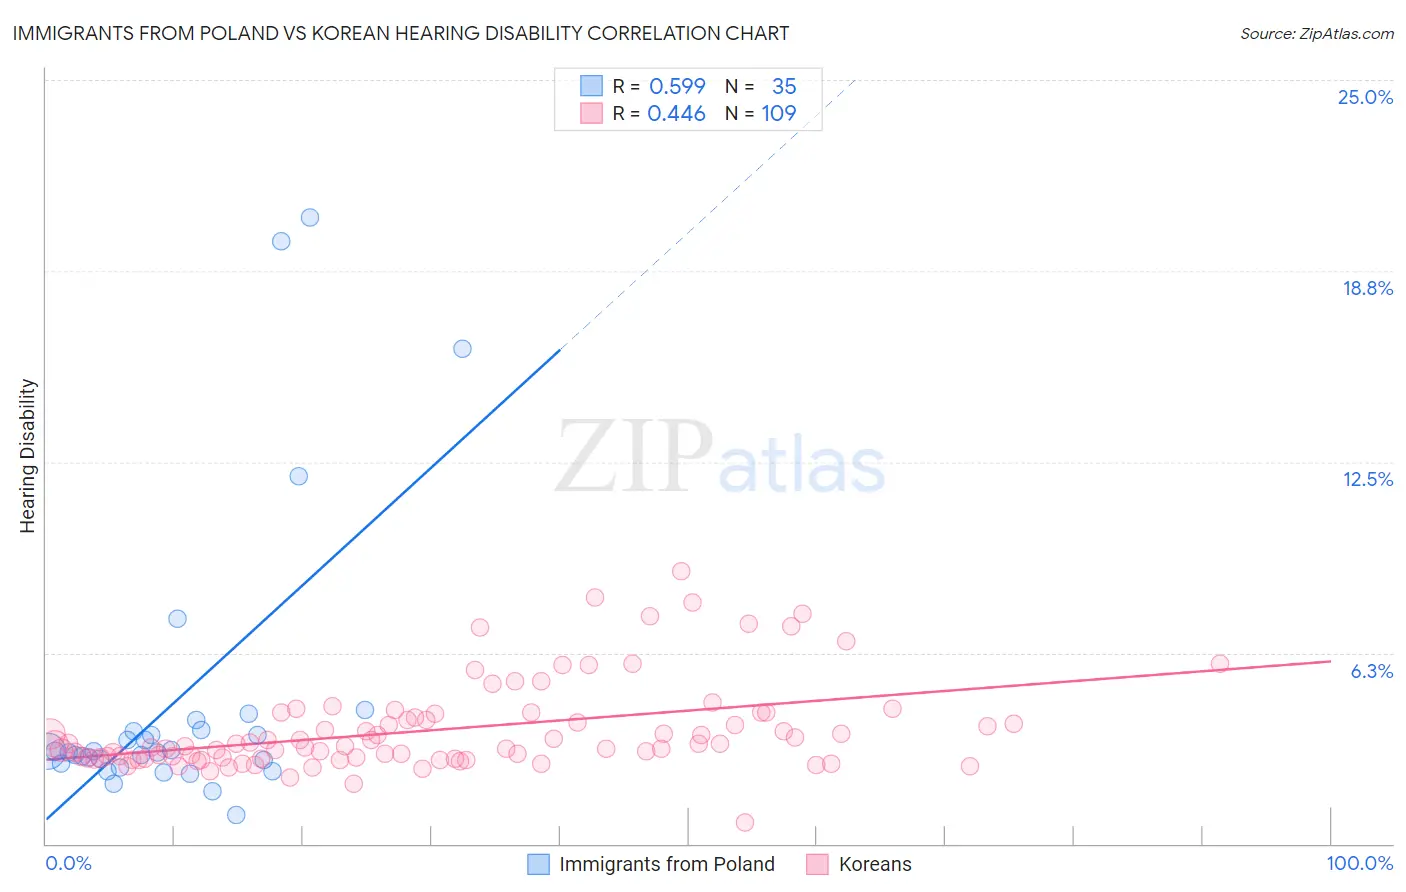
Immigrants from Poland vs Korean Hearing Disability Correlation Chart
The statistical analysis conducted on geographies consisting of 304,813,024 people shows a substantial positive correlation between the proportion of Immigrants from Poland and percentage of population with hearing disability in the United States with a correlation coefficient (R) of 0.599 and weighted average of 2.9%. Similarly, the statistical analysis conducted on geographies consisting of 510,543,353 people shows a moderate positive correlation between the proportion of Koreans and percentage of population with hearing disability in the United States with a correlation coefficient (R) of 0.446 and weighted average of 3.1%, a difference of 4.3%.
Hearing Disability Correlation Summary
| Measurement | Immigrants from Poland | Korean |
| Minimum | 0.95% | 0.70% |
| Maximum | 20.5% | 8.9% |
| Range | 19.6% | 8.2% |
| Mean | 4.7% | 3.7% |
| Median | 3.0% | 3.2% |
| Interquartile 25% (IQ1) | 2.6% | 2.8% |
| Interquartile 75% (IQ3) | 3.7% | 4.2% |
| Interquartile Range (IQR) | 1.1% | 1.4% |
| Standard Deviation (Sample) | 4.8% | 1.5% |
| Standard Deviation (Population) | 4.7% | 1.5% |
Similar Demographics by Hearing Disability
Demographics Similar to Immigrants from Poland by Hearing Disability
In terms of hearing disability, the demographic groups most similar to Immigrants from Poland are Immigrants from Kazakhstan (2.9%, a difference of 0.070%), Immigrants from Burma/Myanmar (2.9%, a difference of 0.080%), Costa Rican (2.9%, a difference of 0.14%), Immigrants from Lebanon (2.9%, a difference of 0.15%), and Sudanese (2.9%, a difference of 0.23%).
| Demographics | Rating | Rank | Hearing Disability |
| Immigrants | Panama | 76.9 /100 | #149 | Good 2.9% |
| Palestinians | 73.6 /100 | #150 | Good 2.9% |
| Immigrants | France | 73.1 /100 | #151 | Good 2.9% |
| Immigrants | Lithuania | 73.0 /100 | #152 | Good 2.9% |
| Sudanese | 72.1 /100 | #153 | Good 2.9% |
| Immigrants | Lebanon | 71.5 /100 | #154 | Good 2.9% |
| Costa Ricans | 71.4 /100 | #155 | Good 2.9% |
| Immigrants | Poland | 70.2 /100 | #156 | Good 2.9% |
| Immigrants | Kazakhstan | 69.6 /100 | #157 | Good 2.9% |
| Immigrants | Burma/Myanmar | 69.5 /100 | #158 | Good 2.9% |
| Immigrants | Australia | 67.4 /100 | #159 | Good 2.9% |
| Immigrants | Fiji | 67.1 /100 | #160 | Good 2.9% |
| Albanians | 66.6 /100 | #161 | Good 2.9% |
| Immigrants | Japan | 66.3 /100 | #162 | Good 2.9% |
| Immigrants | Central America | 64.9 /100 | #163 | Good 3.0% |
Demographics Similar to Koreans by Hearing Disability
In terms of hearing disability, the demographic groups most similar to Koreans are Macedonian (3.1%, a difference of 0.080%), Immigrants from Switzerland (3.1%, a difference of 0.13%), South African (3.1%, a difference of 0.37%), Immigrants from South Africa (3.1%, a difference of 0.38%), and Spanish American Indian (3.1%, a difference of 0.42%).
| Demographics | Rating | Rank | Hearing Disability |
| Immigrants | Southern Europe | 35.3 /100 | #185 | Fair 3.0% |
| Immigrants | Mexico | 34.9 /100 | #186 | Fair 3.0% |
| Blacks/African Americans | 34.7 /100 | #187 | Fair 3.0% |
| Mexican American Indians | 34.7 /100 | #188 | Fair 3.0% |
| Africans | 32.9 /100 | #189 | Fair 3.0% |
| Immigrants | South Africa | 31.1 /100 | #190 | Fair 3.1% |
| Immigrants | Switzerland | 28.8 /100 | #191 | Fair 3.1% |
| Koreans | 27.6 /100 | #192 | Fair 3.1% |
| Macedonians | 27.0 /100 | #193 | Fair 3.1% |
| South Africans | 24.5 /100 | #194 | Fair 3.1% |
| Spanish American Indians | 24.1 /100 | #195 | Fair 3.1% |
| Immigrants | Europe | 22.9 /100 | #196 | Fair 3.1% |
| Immigrants | Bosnia and Herzegovina | 20.6 /100 | #197 | Fair 3.1% |
| Immigrants | Croatia | 20.5 /100 | #198 | Fair 3.1% |
| Syrians | 19.2 /100 | #199 | Poor 3.1% |