Zimbabwean vs Immigrants from Bolivia Hearing Disability
COMPARE
Zimbabwean
Immigrants from Bolivia
Hearing Disability
Hearing Disability Comparison
Zimbabweans
Immigrants from Bolivia
2.8%
HEARING DISABILITY
89.9/ 100
METRIC RATING
118th/ 347
METRIC RANK
2.5%
HEARING DISABILITY
99.8/ 100
METRIC RATING
20th/ 347
METRIC RANK
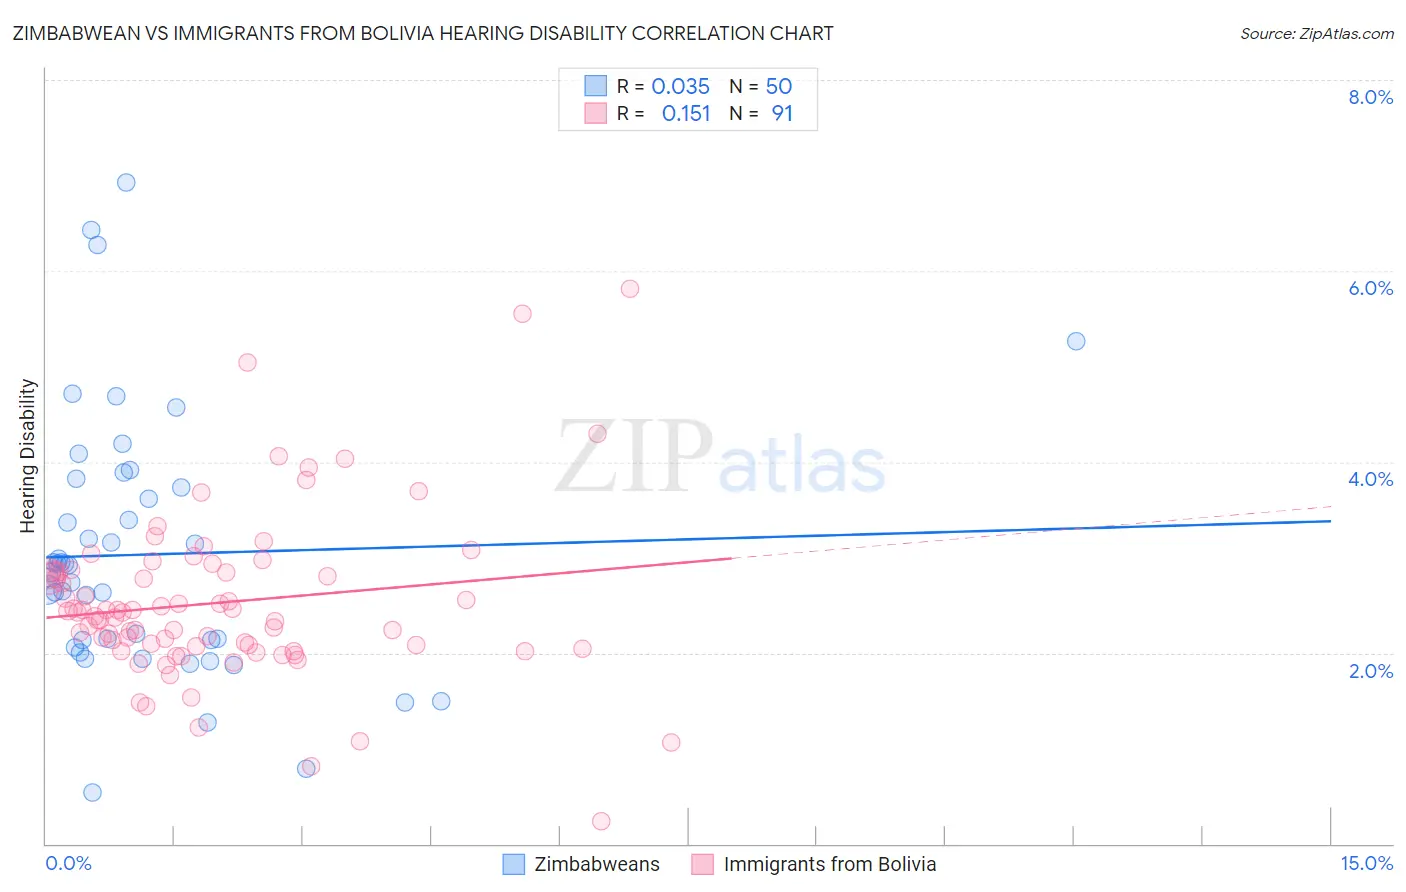
Zimbabwean vs Immigrants from Bolivia Hearing Disability Correlation Chart
The statistical analysis conducted on geographies consisting of 69,200,821 people shows no correlation between the proportion of Zimbabweans and percentage of population with hearing disability in the United States with a correlation coefficient (R) of 0.035 and weighted average of 2.8%. Similarly, the statistical analysis conducted on geographies consisting of 158,707,824 people shows a poor positive correlation between the proportion of Immigrants from Bolivia and percentage of population with hearing disability in the United States with a correlation coefficient (R) of 0.151 and weighted average of 2.5%, a difference of 11.5%.
Hearing Disability Correlation Summary
| Measurement | Zimbabwean | Immigrants from Bolivia |
| Minimum | 0.53% | 0.24% |
| Maximum | 6.9% | 5.8% |
| Range | 6.4% | 5.6% |
| Mean | 3.0% | 2.5% |
| Median | 2.9% | 2.4% |
| Interquartile 25% (IQ1) | 2.1% | 2.1% |
| Interquartile 75% (IQ3) | 3.7% | 2.9% |
| Interquartile Range (IQR) | 1.6% | 0.79% |
| Standard Deviation (Sample) | 1.3% | 0.88% |
| Standard Deviation (Population) | 1.3% | 0.87% |
Similar Demographics by Hearing Disability
Demographics Similar to Zimbabweans by Hearing Disability
In terms of hearing disability, the demographic groups most similar to Zimbabweans are Immigrants from Liberia (2.8%, a difference of 0.010%), Kenyan (2.8%, a difference of 0.020%), Immigrants (2.8%, a difference of 0.10%), Jordanian (2.8%, a difference of 0.11%), and Cuban (2.8%, a difference of 0.14%).
| Demographics | Rating | Rank | Hearing Disability |
| Immigrants | Yemen | 92.7 /100 | #111 | Exceptional 2.8% |
| U.S. Virgin Islanders | 92.5 /100 | #112 | Exceptional 2.8% |
| Immigrants | Belarus | 91.6 /100 | #113 | Exceptional 2.8% |
| Cambodians | 91.1 /100 | #114 | Exceptional 2.8% |
| Immigrants | Latin America | 90.5 /100 | #115 | Exceptional 2.8% |
| Immigrants | Immigrants | 90.3 /100 | #116 | Exceptional 2.8% |
| Immigrants | Liberia | 90.0 /100 | #117 | Excellent 2.8% |
| Zimbabweans | 89.9 /100 | #118 | Excellent 2.8% |
| Kenyans | 89.8 /100 | #119 | Excellent 2.8% |
| Jordanians | 89.5 /100 | #120 | Excellent 2.8% |
| Cubans | 89.4 /100 | #121 | Excellent 2.8% |
| Liberians | 89.0 /100 | #122 | Excellent 2.8% |
| Immigrants | Zaire | 88.6 /100 | #123 | Excellent 2.9% |
| Bahamians | 88.6 /100 | #124 | Excellent 2.9% |
| Immigrants | Albania | 88.5 /100 | #125 | Excellent 2.9% |
Demographics Similar to Immigrants from Bolivia by Hearing Disability
In terms of hearing disability, the demographic groups most similar to Immigrants from Bolivia are Thai (2.5%, a difference of 0.050%), Dominican (2.5%, a difference of 0.070%), Ghanaian (2.5%, a difference of 0.070%), Immigrants from Sierra Leone (2.6%, a difference of 0.11%), and Immigrants from Nigeria (2.6%, a difference of 0.61%).
| Demographics | Rating | Rank | Hearing Disability |
| Sierra Leoneans | 99.9 /100 | #13 | Exceptional 2.5% |
| Ecuadorians | 99.9 /100 | #14 | Exceptional 2.5% |
| Barbadians | 99.9 /100 | #15 | Exceptional 2.5% |
| Immigrants | West Indies | 99.9 /100 | #16 | Exceptional 2.5% |
| Immigrants | India | 99.9 /100 | #17 | Exceptional 2.5% |
| Dominicans | 99.8 /100 | #18 | Exceptional 2.5% |
| Thais | 99.8 /100 | #19 | Exceptional 2.5% |
| Immigrants | Bolivia | 99.8 /100 | #20 | Exceptional 2.5% |
| Ghanaians | 99.8 /100 | #21 | Exceptional 2.5% |
| Immigrants | Sierra Leone | 99.8 /100 | #22 | Exceptional 2.6% |
| Immigrants | Nigeria | 99.8 /100 | #23 | Exceptional 2.6% |
| Immigrants | Ghana | 99.8 /100 | #24 | Exceptional 2.6% |
| Immigrants | El Salvador | 99.7 /100 | #25 | Exceptional 2.6% |
| Immigrants | Senegal | 99.7 /100 | #26 | Exceptional 2.6% |
| Immigrants | South Central Asia | 99.7 /100 | #27 | Exceptional 2.6% |