French vs Korean Hearing Disability
COMPARE
French
Korean
Hearing Disability
Hearing Disability Comparison
French
Koreans
3.8%
HEARING DISABILITY
0.0/ 100
METRIC RATING
304th/ 347
METRIC RANK
3.1%
HEARING DISABILITY
27.6/ 100
METRIC RATING
192nd/ 347
METRIC RANK
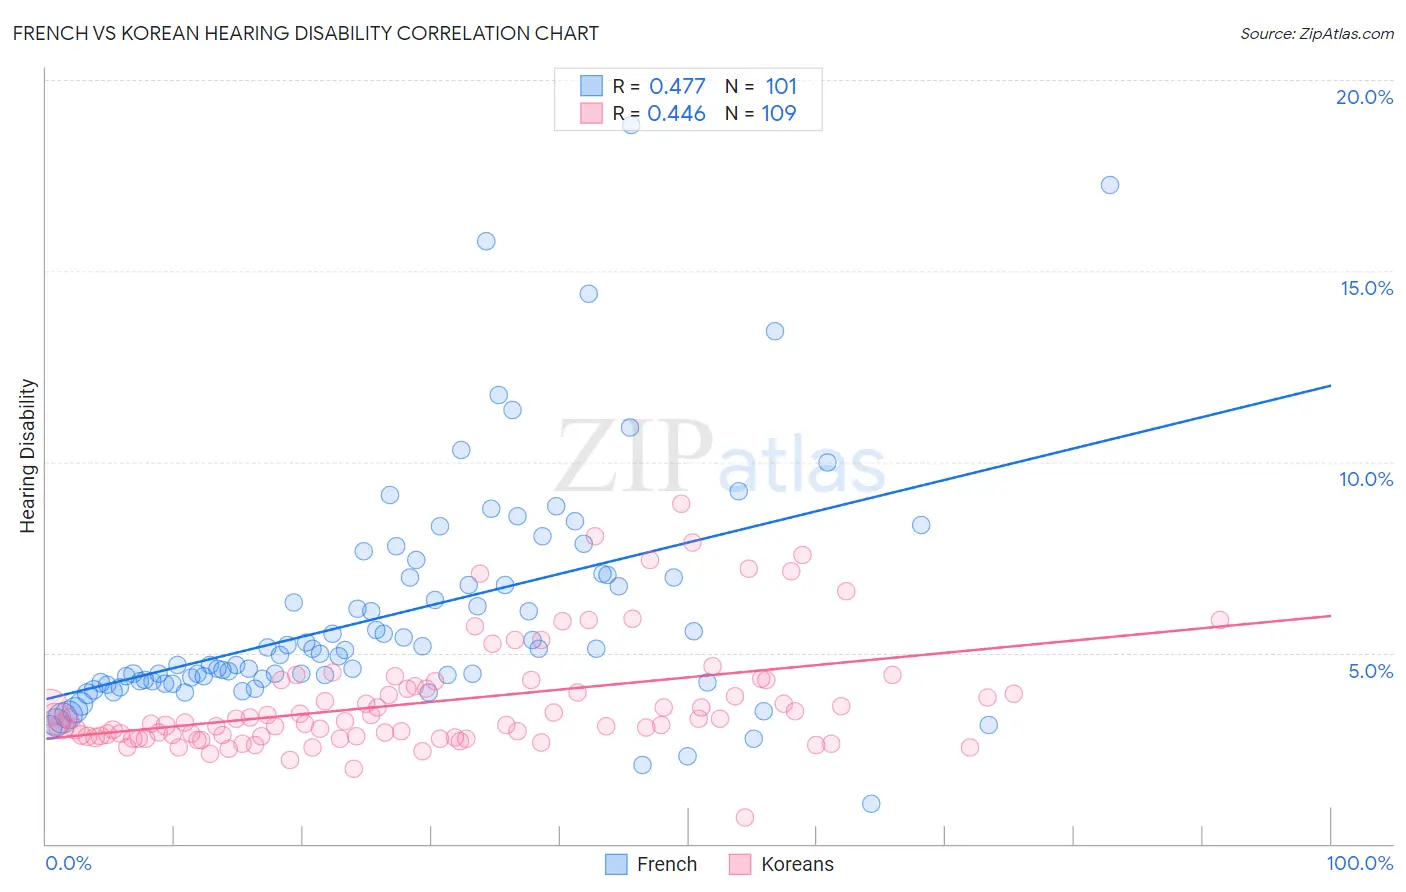
French vs Korean Hearing Disability Correlation Chart
The statistical analysis conducted on geographies consisting of 571,744,911 people shows a moderate positive correlation between the proportion of French and percentage of population with hearing disability in the United States with a correlation coefficient (R) of 0.477 and weighted average of 3.8%. Similarly, the statistical analysis conducted on geographies consisting of 510,543,353 people shows a moderate positive correlation between the proportion of Koreans and percentage of population with hearing disability in the United States with a correlation coefficient (R) of 0.446 and weighted average of 3.1%, a difference of 22.6%.
Hearing Disability Correlation Summary
| Measurement | French | Korean |
| Minimum | 1.1% | 0.70% |
| Maximum | 18.8% | 8.9% |
| Range | 17.8% | 8.2% |
| Mean | 6.0% | 3.7% |
| Median | 5.0% | 3.2% |
| Interquartile 25% (IQ1) | 4.2% | 2.8% |
| Interquartile 75% (IQ3) | 7.0% | 4.2% |
| Interquartile Range (IQR) | 2.8% | 1.4% |
| Standard Deviation (Sample) | 3.1% | 1.5% |
| Standard Deviation (Population) | 3.1% | 1.5% |
Similar Demographics by Hearing Disability
Demographics Similar to French by Hearing Disability
In terms of hearing disability, the demographic groups most similar to French are Menominee (3.7%, a difference of 0.30%), Dutch (3.7%, a difference of 0.36%), Pennsylvania German (3.7%, a difference of 0.47%), Scottish (3.7%, a difference of 0.49%), and German (3.7%, a difference of 0.56%).
| Demographics | Rating | Rank | Hearing Disability |
| Immigrants | Azores | 0.0 /100 | #297 | Tragic 3.7% |
| Celtics | 0.0 /100 | #298 | Tragic 3.7% |
| Germans | 0.0 /100 | #299 | Tragic 3.7% |
| Scottish | 0.0 /100 | #300 | Tragic 3.7% |
| Pennsylvania Germans | 0.0 /100 | #301 | Tragic 3.7% |
| Dutch | 0.0 /100 | #302 | Tragic 3.7% |
| Menominee | 0.0 /100 | #303 | Tragic 3.7% |
| French | 0.0 /100 | #304 | Tragic 3.8% |
| English | 0.0 /100 | #305 | Tragic 3.8% |
| Marshallese | 0.0 /100 | #306 | Tragic 3.8% |
| French Canadians | 0.0 /100 | #307 | Tragic 3.8% |
| Ottawa | 0.0 /100 | #308 | Tragic 3.8% |
| Scotch-Irish | 0.0 /100 | #309 | Tragic 3.8% |
| Cree | 0.0 /100 | #310 | Tragic 3.8% |
| Americans | 0.0 /100 | #311 | Tragic 3.9% |
Demographics Similar to Koreans by Hearing Disability
In terms of hearing disability, the demographic groups most similar to Koreans are Macedonian (3.1%, a difference of 0.080%), Immigrants from Switzerland (3.1%, a difference of 0.13%), South African (3.1%, a difference of 0.37%), Immigrants from South Africa (3.1%, a difference of 0.38%), and Spanish American Indian (3.1%, a difference of 0.42%).
| Demographics | Rating | Rank | Hearing Disability |
| Immigrants | Southern Europe | 35.3 /100 | #185 | Fair 3.0% |
| Immigrants | Mexico | 34.9 /100 | #186 | Fair 3.0% |
| Blacks/African Americans | 34.7 /100 | #187 | Fair 3.0% |
| Mexican American Indians | 34.7 /100 | #188 | Fair 3.0% |
| Africans | 32.9 /100 | #189 | Fair 3.0% |
| Immigrants | South Africa | 31.1 /100 | #190 | Fair 3.1% |
| Immigrants | Switzerland | 28.8 /100 | #191 | Fair 3.1% |
| Koreans | 27.6 /100 | #192 | Fair 3.1% |
| Macedonians | 27.0 /100 | #193 | Fair 3.1% |
| South Africans | 24.5 /100 | #194 | Fair 3.1% |
| Spanish American Indians | 24.1 /100 | #195 | Fair 3.1% |
| Immigrants | Europe | 22.9 /100 | #196 | Fair 3.1% |
| Immigrants | Bosnia and Herzegovina | 20.6 /100 | #197 | Fair 3.1% |
| Immigrants | Croatia | 20.5 /100 | #198 | Fair 3.1% |
| Syrians | 19.2 /100 | #199 | Poor 3.1% |