Icelander vs Immigrants from Bolivia Hearing Disability
COMPARE
Icelander
Immigrants from Bolivia
Hearing Disability
Hearing Disability Comparison
Icelanders
Immigrants from Bolivia
3.2%
HEARING DISABILITY
5.2/ 100
METRIC RATING
224th/ 347
METRIC RANK
2.5%
HEARING DISABILITY
99.8/ 100
METRIC RATING
20th/ 347
METRIC RANK
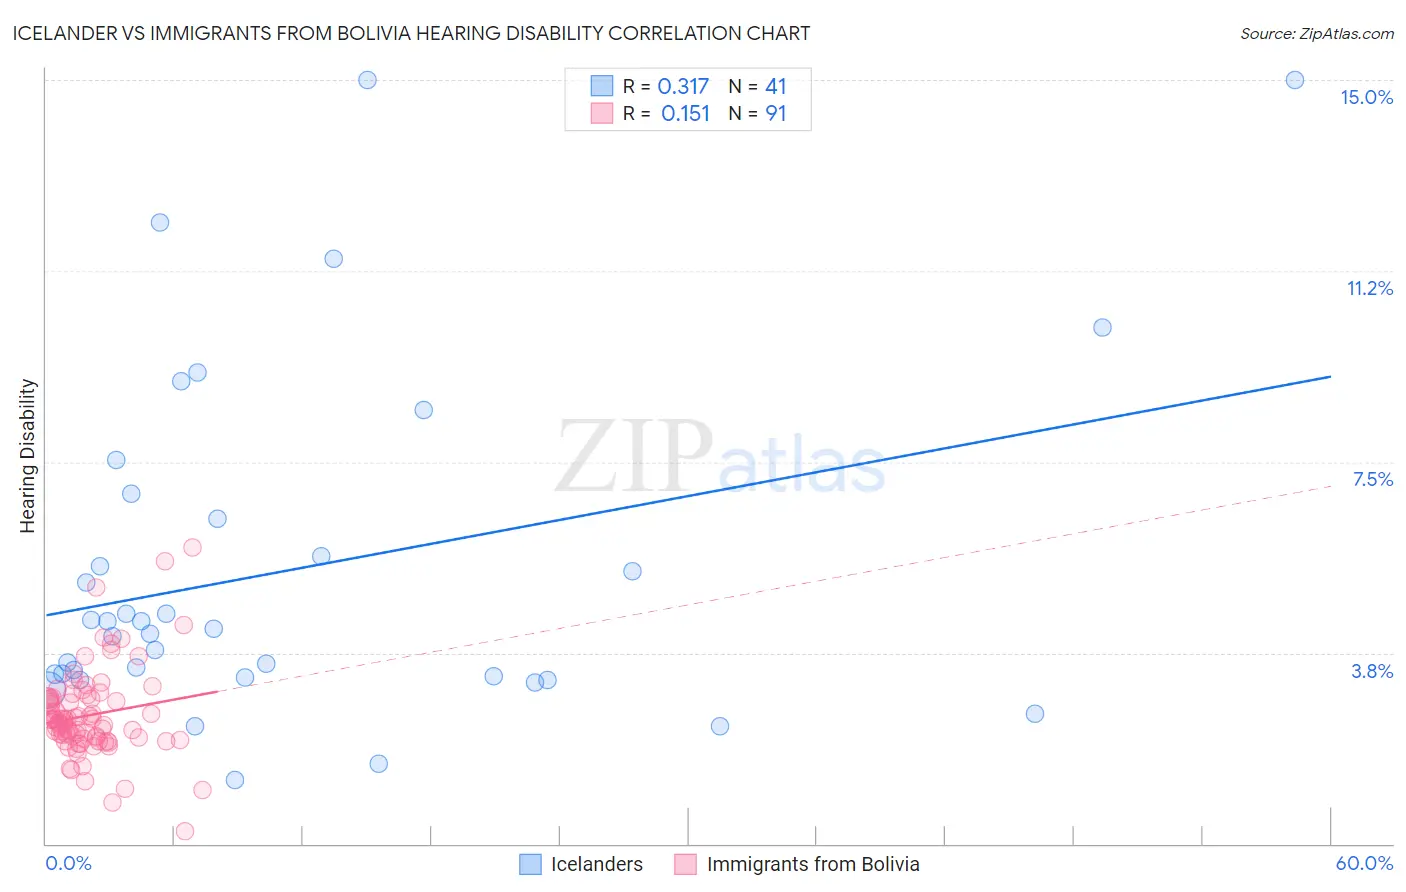
Icelander vs Immigrants from Bolivia Hearing Disability Correlation Chart
The statistical analysis conducted on geographies consisting of 159,637,999 people shows a mild positive correlation between the proportion of Icelanders and percentage of population with hearing disability in the United States with a correlation coefficient (R) of 0.317 and weighted average of 3.2%. Similarly, the statistical analysis conducted on geographies consisting of 158,707,824 people shows a poor positive correlation between the proportion of Immigrants from Bolivia and percentage of population with hearing disability in the United States with a correlation coefficient (R) of 0.151 and weighted average of 2.5%, a difference of 25.6%.
Hearing Disability Correlation Summary
| Measurement | Icelander | Immigrants from Bolivia |
| Minimum | 1.3% | 0.24% |
| Maximum | 15.0% | 5.8% |
| Range | 13.7% | 5.6% |
| Mean | 5.4% | 2.5% |
| Median | 4.2% | 2.4% |
| Interquartile 25% (IQ1) | 3.3% | 2.1% |
| Interquartile 75% (IQ3) | 6.6% | 2.9% |
| Interquartile Range (IQR) | 3.4% | 0.79% |
| Standard Deviation (Sample) | 3.4% | 0.88% |
| Standard Deviation (Population) | 3.3% | 0.87% |
Similar Demographics by Hearing Disability
Demographics Similar to Icelanders by Hearing Disability
In terms of hearing disability, the demographic groups most similar to Icelanders are Latvian (3.2%, a difference of 0.040%), Lebanese (3.2%, a difference of 0.090%), Mexican (3.2%, a difference of 0.17%), Bhutanese (3.2%, a difference of 0.27%), and Immigrants from Portugal (3.2%, a difference of 0.47%).
| Demographics | Rating | Rank | Hearing Disability |
| Russians | 7.1 /100 | #217 | Tragic 3.2% |
| Immigrants | Northern Europe | 7.0 /100 | #218 | Tragic 3.2% |
| New Zealanders | 6.8 /100 | #219 | Tragic 3.2% |
| Malaysians | 6.6 /100 | #220 | Tragic 3.2% |
| Immigrants | Laos | 6.6 /100 | #221 | Tragic 3.2% |
| Immigrants | Oceania | 6.5 /100 | #222 | Tragic 3.2% |
| Mexicans | 5.6 /100 | #223 | Tragic 3.2% |
| Icelanders | 5.2 /100 | #224 | Tragic 3.2% |
| Latvians | 5.1 /100 | #225 | Tragic 3.2% |
| Lebanese | 5.0 /100 | #226 | Tragic 3.2% |
| Bhutanese | 4.6 /100 | #227 | Tragic 3.2% |
| Immigrants | Portugal | 4.3 /100 | #228 | Tragic 3.2% |
| Maltese | 4.1 /100 | #229 | Tragic 3.2% |
| Greeks | 3.2 /100 | #230 | Tragic 3.2% |
| Luxembourgers | 2.9 /100 | #231 | Tragic 3.2% |
Demographics Similar to Immigrants from Bolivia by Hearing Disability
In terms of hearing disability, the demographic groups most similar to Immigrants from Bolivia are Thai (2.5%, a difference of 0.050%), Dominican (2.5%, a difference of 0.070%), Ghanaian (2.5%, a difference of 0.070%), Immigrants from Sierra Leone (2.6%, a difference of 0.11%), and Immigrants from Nigeria (2.6%, a difference of 0.61%).
| Demographics | Rating | Rank | Hearing Disability |
| Sierra Leoneans | 99.9 /100 | #13 | Exceptional 2.5% |
| Ecuadorians | 99.9 /100 | #14 | Exceptional 2.5% |
| Barbadians | 99.9 /100 | #15 | Exceptional 2.5% |
| Immigrants | West Indies | 99.9 /100 | #16 | Exceptional 2.5% |
| Immigrants | India | 99.9 /100 | #17 | Exceptional 2.5% |
| Dominicans | 99.8 /100 | #18 | Exceptional 2.5% |
| Thais | 99.8 /100 | #19 | Exceptional 2.5% |
| Immigrants | Bolivia | 99.8 /100 | #20 | Exceptional 2.5% |
| Ghanaians | 99.8 /100 | #21 | Exceptional 2.5% |
| Immigrants | Sierra Leone | 99.8 /100 | #22 | Exceptional 2.6% |
| Immigrants | Nigeria | 99.8 /100 | #23 | Exceptional 2.6% |
| Immigrants | Ghana | 99.8 /100 | #24 | Exceptional 2.6% |
| Immigrants | El Salvador | 99.7 /100 | #25 | Exceptional 2.6% |
| Immigrants | Senegal | 99.7 /100 | #26 | Exceptional 2.6% |
| Immigrants | South Central Asia | 99.7 /100 | #27 | Exceptional 2.6% |