Yup'ik vs Immigrants from Belarus Hearing Disability
COMPARE
Yup'ik
Immigrants from Belarus
Hearing Disability
Hearing Disability Comparison
Yup'ik
Immigrants from Belarus
5.8%
HEARING DISABILITY
0.0/ 100
METRIC RATING
347th/ 347
METRIC RANK
2.8%
HEARING DISABILITY
91.6/ 100
METRIC RATING
113th/ 347
METRIC RANK
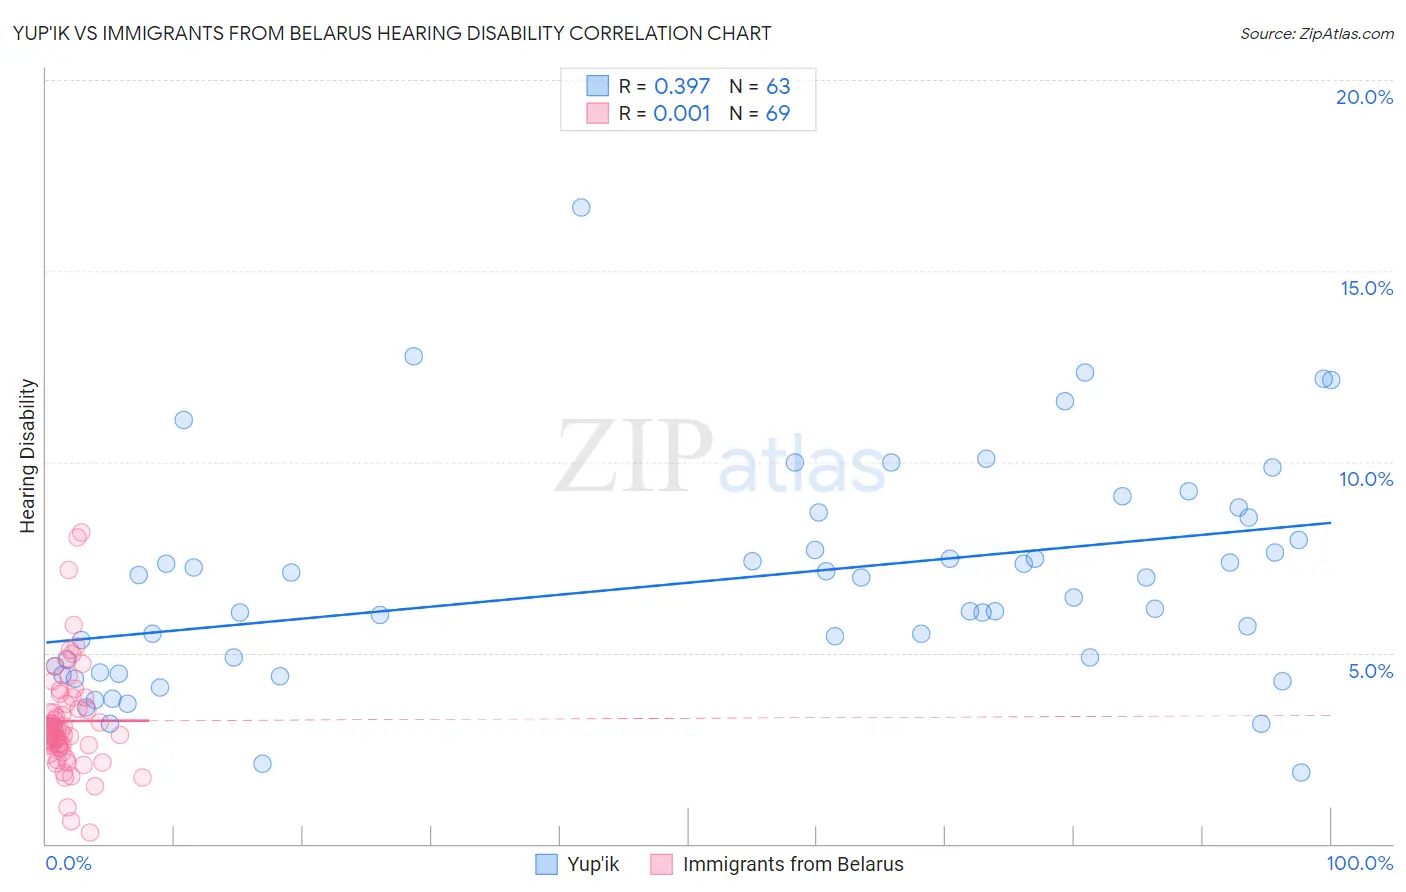
Yup'ik vs Immigrants from Belarus Hearing Disability Correlation Chart
The statistical analysis conducted on geographies consisting of 39,958,202 people shows a mild positive correlation between the proportion of Yup'ik and percentage of population with hearing disability in the United States with a correlation coefficient (R) of 0.397 and weighted average of 5.8%. Similarly, the statistical analysis conducted on geographies consisting of 150,178,365 people shows no correlation between the proportion of Immigrants from Belarus and percentage of population with hearing disability in the United States with a correlation coefficient (R) of 0.001 and weighted average of 2.8%, a difference of 106.7%.
Hearing Disability Correlation Summary
| Measurement | Yup'ik | Immigrants from Belarus |
| Minimum | 1.9% | 0.28% |
| Maximum | 16.7% | 8.1% |
| Range | 14.8% | 7.9% |
| Mean | 6.8% | 3.2% |
| Median | 6.5% | 2.9% |
| Interquartile 25% (IQ1) | 4.5% | 2.5% |
| Interquartile 75% (IQ3) | 8.5% | 3.7% |
| Interquartile Range (IQR) | 4.1% | 1.2% |
| Standard Deviation (Sample) | 2.9% | 1.4% |
| Standard Deviation (Population) | 2.9% | 1.4% |
Similar Demographics by Hearing Disability
Demographics Similar to Yup'ik by Hearing Disability
In terms of hearing disability, the demographic groups most similar to Yup'ik are Colville (5.3%, a difference of 9.3%), Alaskan Athabascan (5.3%, a difference of 9.7%), Tlingit-Haida (4.8%, a difference of 20.6%), Inupiat (4.7%, a difference of 23.9%), and Tsimshian (4.7%, a difference of 24.2%).
| Demographics | Rating | Rank | Hearing Disability |
| Dutch West Indians | 0.0 /100 | #333 | Tragic 4.3% |
| Aleuts | 0.0 /100 | #334 | Tragic 4.3% |
| Kiowa | 0.0 /100 | #335 | Tragic 4.3% |
| Creek | 0.0 /100 | #336 | Tragic 4.4% |
| Chickasaw | 0.0 /100 | #337 | Tragic 4.5% |
| Alaska Natives | 0.0 /100 | #338 | Tragic 4.5% |
| Choctaw | 0.0 /100 | #339 | Tragic 4.5% |
| Pueblo | 0.0 /100 | #340 | Tragic 4.6% |
| Navajo | 0.0 /100 | #341 | Tragic 4.6% |
| Tsimshian | 0.0 /100 | #342 | Tragic 4.7% |
| Inupiat | 0.0 /100 | #343 | Tragic 4.7% |
| Tlingit-Haida | 0.0 /100 | #344 | Tragic 4.8% |
| Alaskan Athabascans | 0.0 /100 | #345 | Tragic 5.3% |
| Colville | 0.0 /100 | #346 | Tragic 5.3% |
| Yup'ik | 0.0 /100 | #347 | Tragic 5.8% |
Demographics Similar to Immigrants from Belarus by Hearing Disability
In terms of hearing disability, the demographic groups most similar to Immigrants from Belarus are Cambodian (2.8%, a difference of 0.17%), U.S. Virgin Islander (2.8%, a difference of 0.31%), Immigrants from Latin America (2.8%, a difference of 0.34%), Immigrants from Yemen (2.8%, a difference of 0.39%), and Immigrants (2.8%, a difference of 0.41%).
| Demographics | Rating | Rank | Hearing Disability |
| Hondurans | 93.4 /100 | #106 | Exceptional 2.8% |
| Immigrants | Chile | 93.4 /100 | #107 | Exceptional 2.8% |
| Guatemalans | 93.2 /100 | #108 | Exceptional 2.8% |
| Turks | 93.0 /100 | #109 | Exceptional 2.8% |
| Cypriots | 92.9 /100 | #110 | Exceptional 2.8% |
| Immigrants | Yemen | 92.7 /100 | #111 | Exceptional 2.8% |
| U.S. Virgin Islanders | 92.5 /100 | #112 | Exceptional 2.8% |
| Immigrants | Belarus | 91.6 /100 | #113 | Exceptional 2.8% |
| Cambodians | 91.1 /100 | #114 | Exceptional 2.8% |
| Immigrants | Latin America | 90.5 /100 | #115 | Exceptional 2.8% |
| Immigrants | Immigrants | 90.3 /100 | #116 | Exceptional 2.8% |
| Immigrants | Liberia | 90.0 /100 | #117 | Excellent 2.8% |
| Zimbabweans | 89.9 /100 | #118 | Excellent 2.8% |
| Kenyans | 89.8 /100 | #119 | Excellent 2.8% |
| Jordanians | 89.5 /100 | #120 | Excellent 2.8% |