Nicaraguan vs Menominee Disability Age Over 75
COMPARE
Nicaraguan
Menominee
Disability Age Over 75
Disability Age Over 75 Comparison
Nicaraguans
Menominee
48.3%
DISABILITY AGE OVER 75
3.0/ 100
METRIC RATING
238th/ 347
METRIC RANK
52.3%
DISABILITY AGE OVER 75
0.0/ 100
METRIC RATING
324th/ 347
METRIC RANK
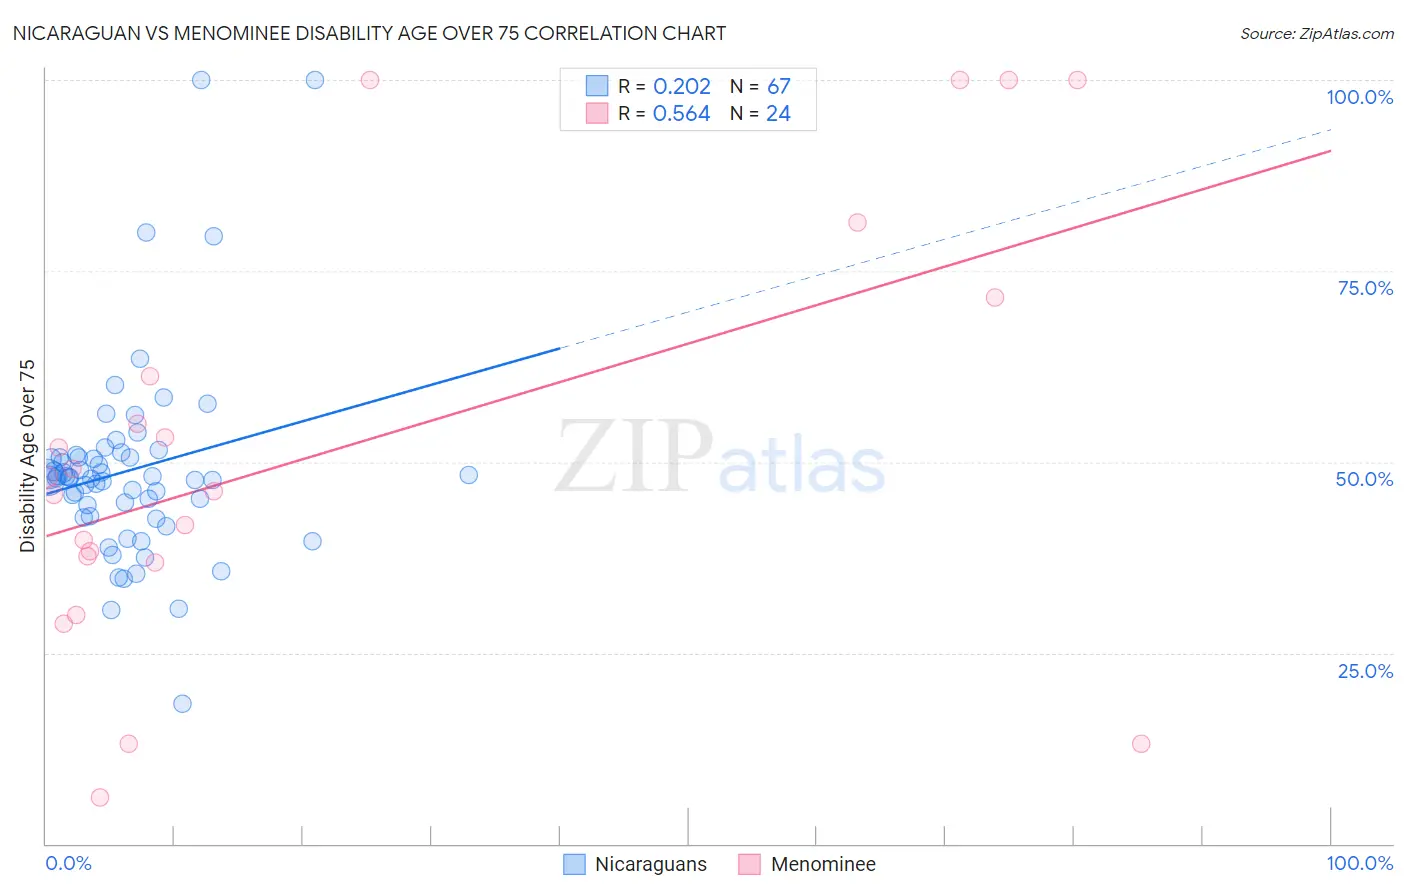
Nicaraguan vs Menominee Disability Age Over 75 Correlation Chart
The statistical analysis conducted on geographies consisting of 285,291,775 people shows a weak positive correlation between the proportion of Nicaraguans and percentage of population with a disability over the age of 75 in the United States with a correlation coefficient (R) of 0.202 and weighted average of 48.3%. Similarly, the statistical analysis conducted on geographies consisting of 45,777,346 people shows a substantial positive correlation between the proportion of Menominee and percentage of population with a disability over the age of 75 in the United States with a correlation coefficient (R) of 0.564 and weighted average of 52.3%, a difference of 8.4%.
Disability Age Over 75 Correlation Summary
| Measurement | Nicaraguan | Menominee |
| Minimum | 18.3% | 6.1% |
| Maximum | 100.0% | 100.0% |
| Range | 81.7% | 93.9% |
| Mean | 48.9% | 52.0% |
| Median | 47.9% | 47.1% |
| Interquartile 25% (IQ1) | 42.8% | 37.2% |
| Interquartile 75% (IQ3) | 50.6% | 66.3% |
| Interquartile Range (IQR) | 7.8% | 29.2% |
| Standard Deviation (Sample) | 13.0% | 27.7% |
| Standard Deviation (Population) | 12.9% | 27.2% |
Similar Demographics by Disability Age Over 75
Demographics Similar to Nicaraguans by Disability Age Over 75
In terms of disability age over 75, the demographic groups most similar to Nicaraguans are Immigrants from Nicaragua (48.2%, a difference of 0.030%), Immigrants from St. Vincent and the Grenadines (48.2%, a difference of 0.030%), Immigrants from Thailand (48.3%, a difference of 0.040%), Subsaharan African (48.2%, a difference of 0.13%), and Hmong (48.2%, a difference of 0.13%).
| Demographics | Rating | Rank | Disability Age Over 75 |
| Immigrants | Immigrants | 4.3 /100 | #231 | Tragic 48.2% |
| Indonesians | 4.2 /100 | #232 | Tragic 48.2% |
| Cree | 4.2 /100 | #233 | Tragic 48.2% |
| Sub-Saharan Africans | 3.8 /100 | #234 | Tragic 48.2% |
| Hmong | 3.8 /100 | #235 | Tragic 48.2% |
| Immigrants | Nicaragua | 3.2 /100 | #236 | Tragic 48.2% |
| Immigrants | St. Vincent and the Grenadines | 3.2 /100 | #237 | Tragic 48.2% |
| Nicaraguans | 3.0 /100 | #238 | Tragic 48.3% |
| Immigrants | Thailand | 2.8 /100 | #239 | Tragic 48.3% |
| Tongans | 2.3 /100 | #240 | Tragic 48.3% |
| Native Hawaiians | 2.2 /100 | #241 | Tragic 48.3% |
| French American Indians | 2.2 /100 | #242 | Tragic 48.3% |
| Immigrants | Caribbean | 2.1 /100 | #243 | Tragic 48.4% |
| Afghans | 1.8 /100 | #244 | Tragic 48.4% |
| Americans | 1.7 /100 | #245 | Tragic 48.4% |
Demographics Similar to Menominee by Disability Age Over 75
In terms of disability age over 75, the demographic groups most similar to Menominee are Immigrants from Cabo Verde (52.4%, a difference of 0.16%), Ute (52.6%, a difference of 0.51%), Nepalese (52.6%, a difference of 0.54%), Immigrants from Yemen (52.0%, a difference of 0.63%), and Choctaw (52.7%, a difference of 0.73%).
| Demographics | Rating | Rank | Disability Age Over 75 |
| Yakama | 0.0 /100 | #317 | Tragic 51.3% |
| Seminole | 0.0 /100 | #318 | Tragic 51.5% |
| Creek | 0.0 /100 | #319 | Tragic 51.5% |
| Paiute | 0.0 /100 | #320 | Tragic 51.5% |
| Dutch West Indians | 0.0 /100 | #321 | Tragic 51.5% |
| Comanche | 0.0 /100 | #322 | Tragic 51.7% |
| Immigrants | Yemen | 0.0 /100 | #323 | Tragic 52.0% |
| Menominee | 0.0 /100 | #324 | Tragic 52.3% |
| Immigrants | Cabo Verde | 0.0 /100 | #325 | Tragic 52.4% |
| Ute | 0.0 /100 | #326 | Tragic 52.6% |
| Nepalese | 0.0 /100 | #327 | Tragic 52.6% |
| Choctaw | 0.0 /100 | #328 | Tragic 52.7% |
| Alaska Natives | 0.0 /100 | #329 | Tragic 52.8% |
| Puerto Ricans | 0.0 /100 | #330 | Tragic 52.9% |
| Hopi | 0.0 /100 | #331 | Tragic 52.9% |