Basque vs Menominee Disability Age Over 75
COMPARE
Basque
Menominee
Disability Age Over 75
Disability Age Over 75 Comparison
Basques
Menominee
47.6%
DISABILITY AGE OVER 75
30.9/ 100
METRIC RATING
188th/ 347
METRIC RANK
52.3%
DISABILITY AGE OVER 75
0.0/ 100
METRIC RATING
324th/ 347
METRIC RANK
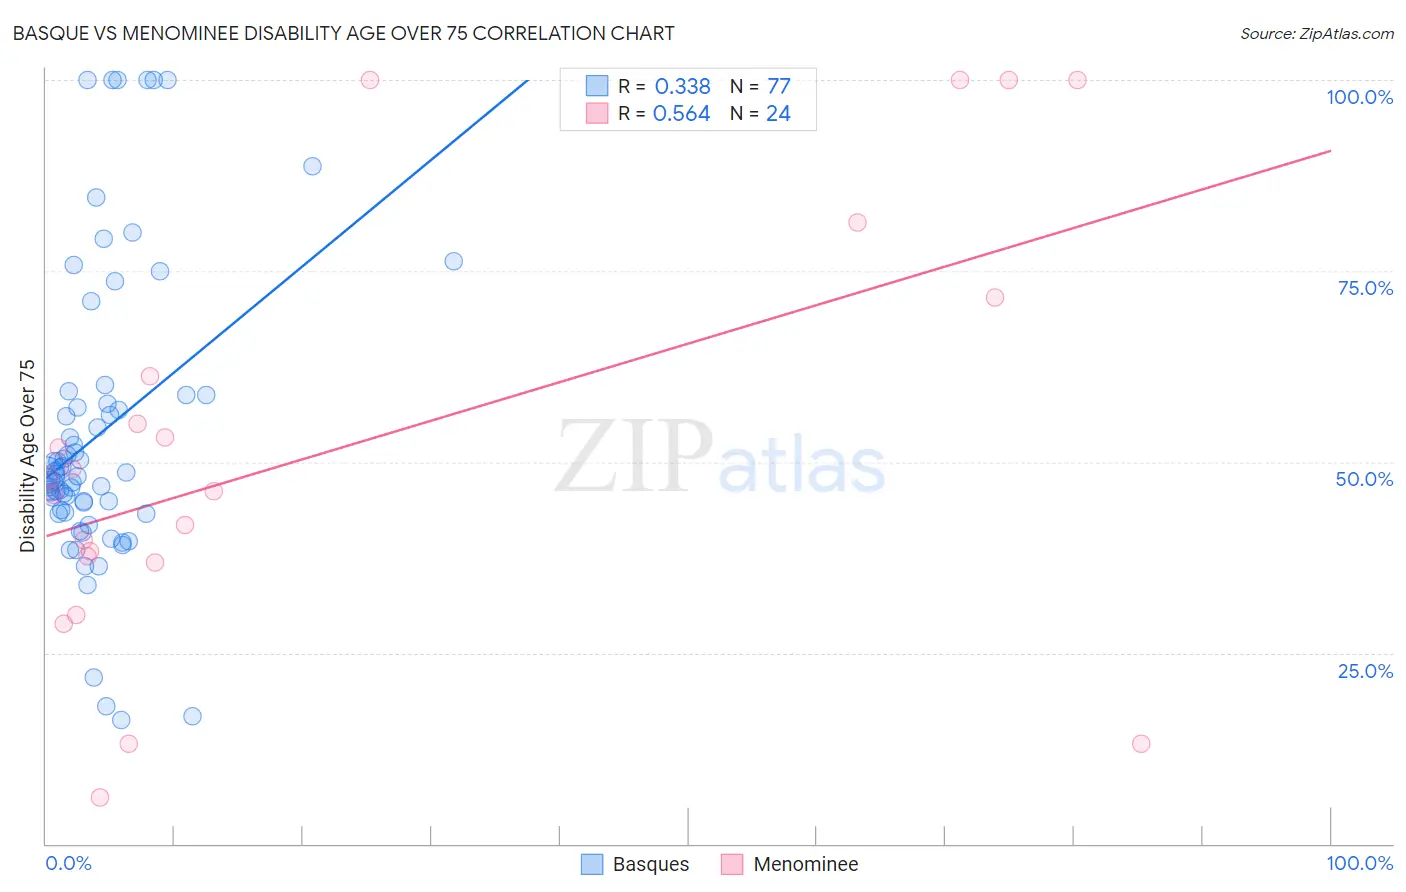
Basque vs Menominee Disability Age Over 75 Correlation Chart
The statistical analysis conducted on geographies consisting of 165,667,068 people shows a mild positive correlation between the proportion of Basques and percentage of population with a disability over the age of 75 in the United States with a correlation coefficient (R) of 0.338 and weighted average of 47.6%. Similarly, the statistical analysis conducted on geographies consisting of 45,777,346 people shows a substantial positive correlation between the proportion of Menominee and percentage of population with a disability over the age of 75 in the United States with a correlation coefficient (R) of 0.564 and weighted average of 52.3%, a difference of 10.0%.
Disability Age Over 75 Correlation Summary
| Measurement | Basque | Menominee |
| Minimum | 16.2% | 6.1% |
| Maximum | 100.0% | 100.0% |
| Range | 83.8% | 93.9% |
| Mean | 53.6% | 52.0% |
| Median | 48.2% | 47.1% |
| Interquartile 25% (IQ1) | 43.5% | 37.2% |
| Interquartile 75% (IQ3) | 58.2% | 66.3% |
| Interquartile Range (IQR) | 14.7% | 29.2% |
| Standard Deviation (Sample) | 19.2% | 27.7% |
| Standard Deviation (Population) | 19.1% | 27.2% |
Similar Demographics by Disability Age Over 75
Demographics Similar to Basques by Disability Age Over 75
In terms of disability age over 75, the demographic groups most similar to Basques are Immigrants from Kenya (47.6%, a difference of 0.0%), Immigrants from Sudan (47.5%, a difference of 0.020%), Sudanese (47.5%, a difference of 0.030%), Somali (47.6%, a difference of 0.040%), and Portuguese (47.6%, a difference of 0.040%).
| Demographics | Rating | Rank | Disability Age Over 75 |
| Immigrants | Kazakhstan | 40.4 /100 | #181 | Average 47.4% |
| Immigrants | Moldova | 39.9 /100 | #182 | Fair 47.4% |
| Delaware | 39.1 /100 | #183 | Fair 47.5% |
| Immigrants | Nigeria | 34.0 /100 | #184 | Fair 47.5% |
| Ghanaians | 33.0 /100 | #185 | Fair 47.5% |
| Sudanese | 32.0 /100 | #186 | Fair 47.5% |
| Immigrants | Sudan | 31.8 /100 | #187 | Fair 47.5% |
| Basques | 30.9 /100 | #188 | Fair 47.6% |
| Immigrants | Kenya | 30.8 /100 | #189 | Fair 47.6% |
| Somalis | 29.5 /100 | #190 | Fair 47.6% |
| Portuguese | 29.3 /100 | #191 | Fair 47.6% |
| Immigrants | Jamaica | 28.3 /100 | #192 | Fair 47.6% |
| Ottawa | 28.1 /100 | #193 | Fair 47.6% |
| Immigrants | Lebanon | 26.5 /100 | #194 | Fair 47.6% |
| Immigrants | Trinidad and Tobago | 25.3 /100 | #195 | Fair 47.6% |
Demographics Similar to Menominee by Disability Age Over 75
In terms of disability age over 75, the demographic groups most similar to Menominee are Immigrants from Cabo Verde (52.4%, a difference of 0.16%), Ute (52.6%, a difference of 0.51%), Nepalese (52.6%, a difference of 0.54%), Immigrants from Yemen (52.0%, a difference of 0.63%), and Choctaw (52.7%, a difference of 0.73%).
| Demographics | Rating | Rank | Disability Age Over 75 |
| Yakama | 0.0 /100 | #317 | Tragic 51.3% |
| Seminole | 0.0 /100 | #318 | Tragic 51.5% |
| Creek | 0.0 /100 | #319 | Tragic 51.5% |
| Paiute | 0.0 /100 | #320 | Tragic 51.5% |
| Dutch West Indians | 0.0 /100 | #321 | Tragic 51.5% |
| Comanche | 0.0 /100 | #322 | Tragic 51.7% |
| Immigrants | Yemen | 0.0 /100 | #323 | Tragic 52.0% |
| Menominee | 0.0 /100 | #324 | Tragic 52.3% |
| Immigrants | Cabo Verde | 0.0 /100 | #325 | Tragic 52.4% |
| Ute | 0.0 /100 | #326 | Tragic 52.6% |
| Nepalese | 0.0 /100 | #327 | Tragic 52.6% |
| Choctaw | 0.0 /100 | #328 | Tragic 52.7% |
| Alaska Natives | 0.0 /100 | #329 | Tragic 52.8% |
| Puerto Ricans | 0.0 /100 | #330 | Tragic 52.9% |
| Hopi | 0.0 /100 | #331 | Tragic 52.9% |