Yup'ik vs Immigrants from Northern Europe Disability Age 18 to 34
COMPARE
Yup'ik
Immigrants from Northern Europe
Disability Age 18 to 34
Disability Age 18 to 34 Comparison
Yup'ik
Immigrants from Northern Europe
6.7%
DISABILITY AGE 18 TO 34
35.3/ 100
METRIC RATING
186th/ 347
METRIC RANK
6.5%
DISABILITY AGE 18 TO 34
64.1/ 100
METRIC RATING
167th/ 347
METRIC RANK
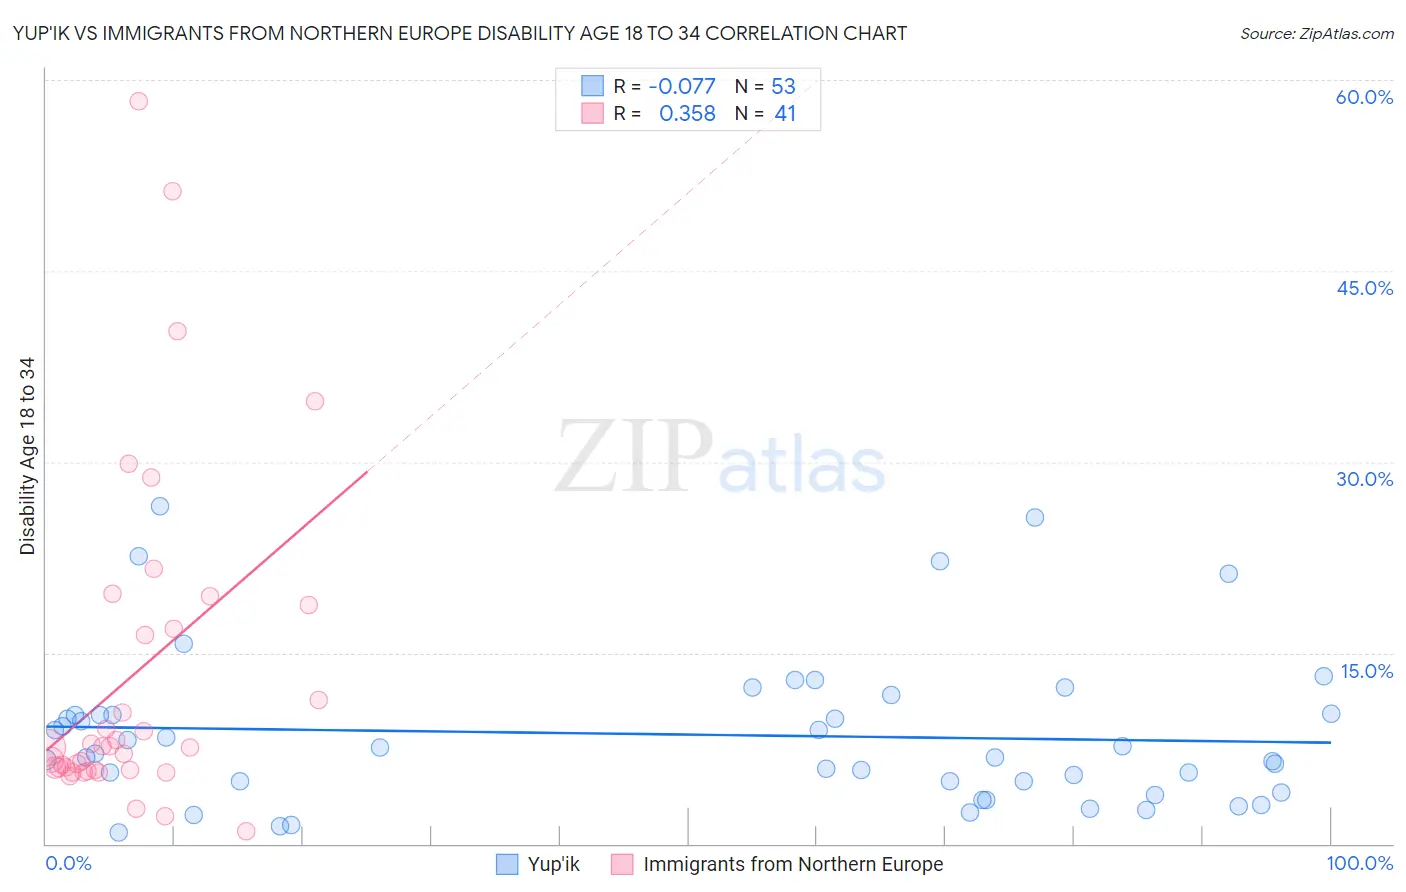
Yup'ik vs Immigrants from Northern Europe Disability Age 18 to 34 Correlation Chart
The statistical analysis conducted on geographies consisting of 39,924,347 people shows a slight negative correlation between the proportion of Yup'ik and percentage of population with a disability between the ages 18 and 35 in the United States with a correlation coefficient (R) of -0.077 and weighted average of 6.7%. Similarly, the statistical analysis conducted on geographies consisting of 475,061,054 people shows a mild positive correlation between the proportion of Immigrants from Northern Europe and percentage of population with a disability between the ages 18 and 35 in the United States with a correlation coefficient (R) of 0.358 and weighted average of 6.5%, a difference of 2.1%.
Disability Age 18 to 34 Correlation Summary
| Measurement | Yup'ik | Immigrants from Northern Europe |
| Minimum | 0.88% | 0.94% |
| Maximum | 26.5% | 58.3% |
| Range | 25.6% | 57.4% |
| Mean | 8.6% | 13.3% |
| Median | 7.1% | 7.6% |
| Interquartile 25% (IQ1) | 4.4% | 5.8% |
| Interquartile 75% (IQ3) | 10.2% | 17.8% |
| Interquartile Range (IQR) | 5.8% | 12.1% |
| Standard Deviation (Sample) | 6.0% | 13.1% |
| Standard Deviation (Population) | 6.0% | 12.9% |
Demographics Similar to Yup'ik and Immigrants from Northern Europe by Disability Age 18 to 34
In terms of disability age 18 to 34, the demographic groups most similar to Yup'ik are Immigrants from Oceania (6.7%, a difference of 0.0%), Iraqi (6.7%, a difference of 0.15%), Immigrants from Iraq (6.7%, a difference of 0.16%), U.S. Virgin Islander (6.7%, a difference of 0.24%), and Immigrants from Austria (6.6%, a difference of 0.31%). Similarly, the demographic groups most similar to Immigrants from Northern Europe are Immigrants from Moldova (6.5%, a difference of 0.070%), Eastern European (6.5%, a difference of 0.080%), Russian (6.5%, a difference of 0.29%), Immigrants from Bahamas (6.6%, a difference of 0.45%), and Bahamian (6.6%, a difference of 0.63%).
| Demographics | Rating | Rank | Disability Age 18 to 34 |
| Eastern Europeans | 65.1 /100 | #166 | Good 6.5% |
| Immigrants | Northern Europe | 64.1 /100 | #167 | Good 6.5% |
| Immigrants | Moldova | 63.1 /100 | #168 | Good 6.5% |
| Russians | 60.2 /100 | #169 | Good 6.5% |
| Immigrants | Bahamas | 57.9 /100 | #170 | Average 6.6% |
| Bahamians | 55.5 /100 | #171 | Average 6.6% |
| Ghanaians | 54.7 /100 | #172 | Average 6.6% |
| Immigrants | Mexico | 54.1 /100 | #173 | Average 6.6% |
| Native Hawaiians | 50.0 /100 | #174 | Average 6.6% |
| Immigrants | Cambodia | 46.5 /100 | #175 | Average 6.6% |
| Immigrants | Africa | 45.9 /100 | #176 | Average 6.6% |
| Syrians | 44.3 /100 | #177 | Average 6.6% |
| Nigerians | 43.7 /100 | #178 | Average 6.6% |
| Immigrants | Ghana | 42.1 /100 | #179 | Average 6.6% |
| Immigrants | Austria | 39.6 /100 | #180 | Fair 6.6% |
| Romanians | 39.5 /100 | #181 | Fair 6.6% |
| U.S. Virgin Islanders | 38.6 /100 | #182 | Fair 6.7% |
| Immigrants | Iraq | 37.4 /100 | #183 | Fair 6.7% |
| Iraqis | 37.4 /100 | #184 | Fair 6.7% |
| Immigrants | Oceania | 35.4 /100 | #185 | Fair 6.7% |
| Yup'ik | 35.3 /100 | #186 | Fair 6.7% |