Yup'ik vs Immigrants from Northern Europe 8th Grade
COMPARE
Yup'ik
Immigrants from Northern Europe
8th Grade
8th Grade Comparison
Yup'ik
Immigrants from Northern Europe
97.0%
8TH GRADE
100.0/ 100
METRIC RATING
32nd/ 347
METRIC RANK
96.7%
8TH GRADE
99.8/ 100
METRIC RATING
60th/ 347
METRIC RANK
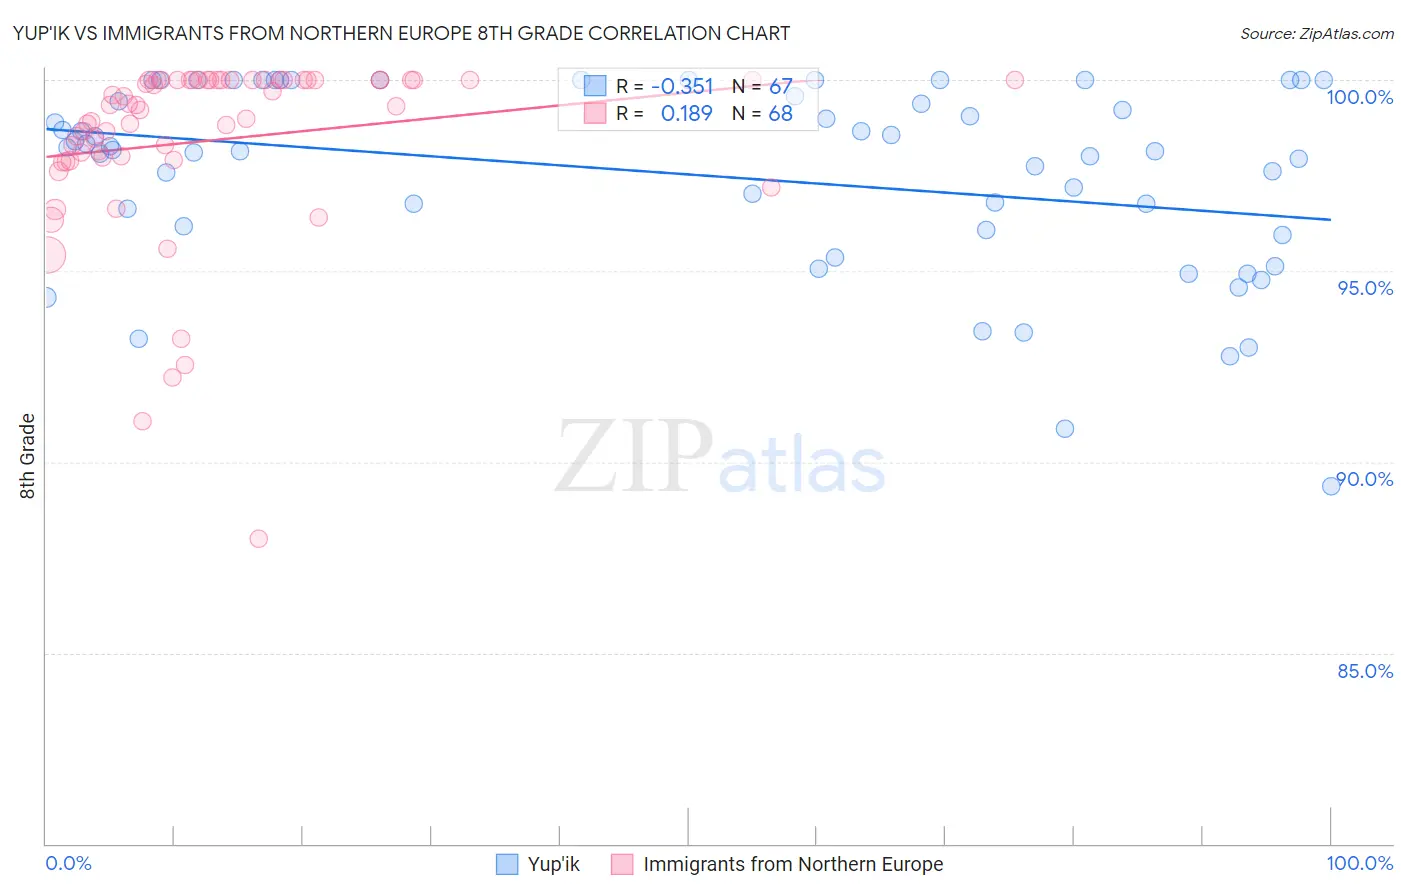
Yup'ik vs Immigrants from Northern Europe 8th Grade Correlation Chart
The statistical analysis conducted on geographies consisting of 39,963,824 people shows a mild negative correlation between the proportion of Yup'ik and percentage of population with at least 8th grade education in the United States with a correlation coefficient (R) of -0.351 and weighted average of 97.0%. Similarly, the statistical analysis conducted on geographies consisting of 477,226,562 people shows a poor positive correlation between the proportion of Immigrants from Northern Europe and percentage of population with at least 8th grade education in the United States with a correlation coefficient (R) of 0.189 and weighted average of 96.7%, a difference of 0.38%.
8th Grade Correlation Summary
| Measurement | Yup'ik | Immigrants from Northern Europe |
| Minimum | 89.4% | 88.0% |
| Maximum | 100.0% | 100.0% |
| Range | 10.6% | 12.0% |
| Mean | 97.5% | 98.4% |
| Median | 98.2% | 99.3% |
| Interquartile 25% (IQ1) | 96.1% | 97.9% |
| Interquartile 75% (IQ3) | 100.0% | 100.0% |
| Interquartile Range (IQR) | 3.9% | 2.1% |
| Standard Deviation (Sample) | 2.5% | 2.4% |
| Standard Deviation (Population) | 2.5% | 2.4% |
Similar Demographics by 8th Grade
Demographics Similar to Yup'ik by 8th Grade
In terms of 8th grade, the demographic groups most similar to Yup'ik are Swiss (97.0%, a difference of 0.010%), Sioux (97.1%, a difference of 0.030%), Chippewa (97.1%, a difference of 0.030%), Luxembourger (97.0%, a difference of 0.040%), and Alaska Native (97.0%, a difference of 0.050%).
| Demographics | Rating | Rank | 8th Grade |
| Czechs | 100.0 /100 | #25 | Exceptional 97.1% |
| French | 100.0 /100 | #26 | Exceptional 97.1% |
| Scotch-Irish | 100.0 /100 | #27 | Exceptional 97.1% |
| Italians | 100.0 /100 | #28 | Exceptional 97.1% |
| Europeans | 100.0 /100 | #29 | Exceptional 97.1% |
| Sioux | 100.0 /100 | #30 | Exceptional 97.1% |
| Chippewa | 100.0 /100 | #31 | Exceptional 97.1% |
| Yup'ik | 100.0 /100 | #32 | Exceptional 97.0% |
| Swiss | 100.0 /100 | #33 | Exceptional 97.0% |
| Luxembourgers | 100.0 /100 | #34 | Exceptional 97.0% |
| Alaska Natives | 100.0 /100 | #35 | Exceptional 97.0% |
| Belgians | 100.0 /100 | #36 | Exceptional 97.0% |
| Latvians | 100.0 /100 | #37 | Exceptional 97.0% |
| British | 100.0 /100 | #38 | Exceptional 97.0% |
| Hungarians | 100.0 /100 | #39 | Exceptional 97.0% |
Demographics Similar to Immigrants from Northern Europe by 8th Grade
In terms of 8th grade, the demographic groups most similar to Immigrants from Northern Europe are Immigrants from North America (96.7%, a difference of 0.0%), Immigrants from Austria (96.7%, a difference of 0.0%), Immigrants from Canada (96.7%, a difference of 0.020%), White/Caucasian (96.7%, a difference of 0.020%), and Ukrainian (96.7%, a difference of 0.030%).
| Demographics | Rating | Rank | 8th Grade |
| Austrians | 99.9 /100 | #53 | Exceptional 96.7% |
| Serbians | 99.8 /100 | #54 | Exceptional 96.7% |
| Russians | 99.8 /100 | #55 | Exceptional 96.7% |
| Australians | 99.8 /100 | #56 | Exceptional 96.7% |
| Macedonians | 99.8 /100 | #57 | Exceptional 96.7% |
| Immigrants | Canada | 99.8 /100 | #58 | Exceptional 96.7% |
| Immigrants | North America | 99.8 /100 | #59 | Exceptional 96.7% |
| Immigrants | Northern Europe | 99.8 /100 | #60 | Exceptional 96.7% |
| Immigrants | Austria | 99.8 /100 | #61 | Exceptional 96.7% |
| Whites/Caucasians | 99.8 /100 | #62 | Exceptional 96.7% |
| Ukrainians | 99.7 /100 | #63 | Exceptional 96.7% |
| Immigrants | India | 99.7 /100 | #64 | Exceptional 96.6% |
| Native Hawaiians | 99.7 /100 | #65 | Exceptional 96.6% |
| Canadians | 99.7 /100 | #66 | Exceptional 96.6% |
| Iranians | 99.7 /100 | #67 | Exceptional 96.6% |