Senegalese vs Immigrants from Honduras Male Disability
COMPARE
Senegalese
Immigrants from Honduras
Male Disability
Male Disability Comparison
Senegalese
Immigrants from Honduras
11.4%
MALE DISABILITY
23.2/ 100
METRIC RATING
191st/ 347
METRIC RANK
11.2%
MALE DISABILITY
48.7/ 100
METRIC RATING
175th/ 347
METRIC RANK
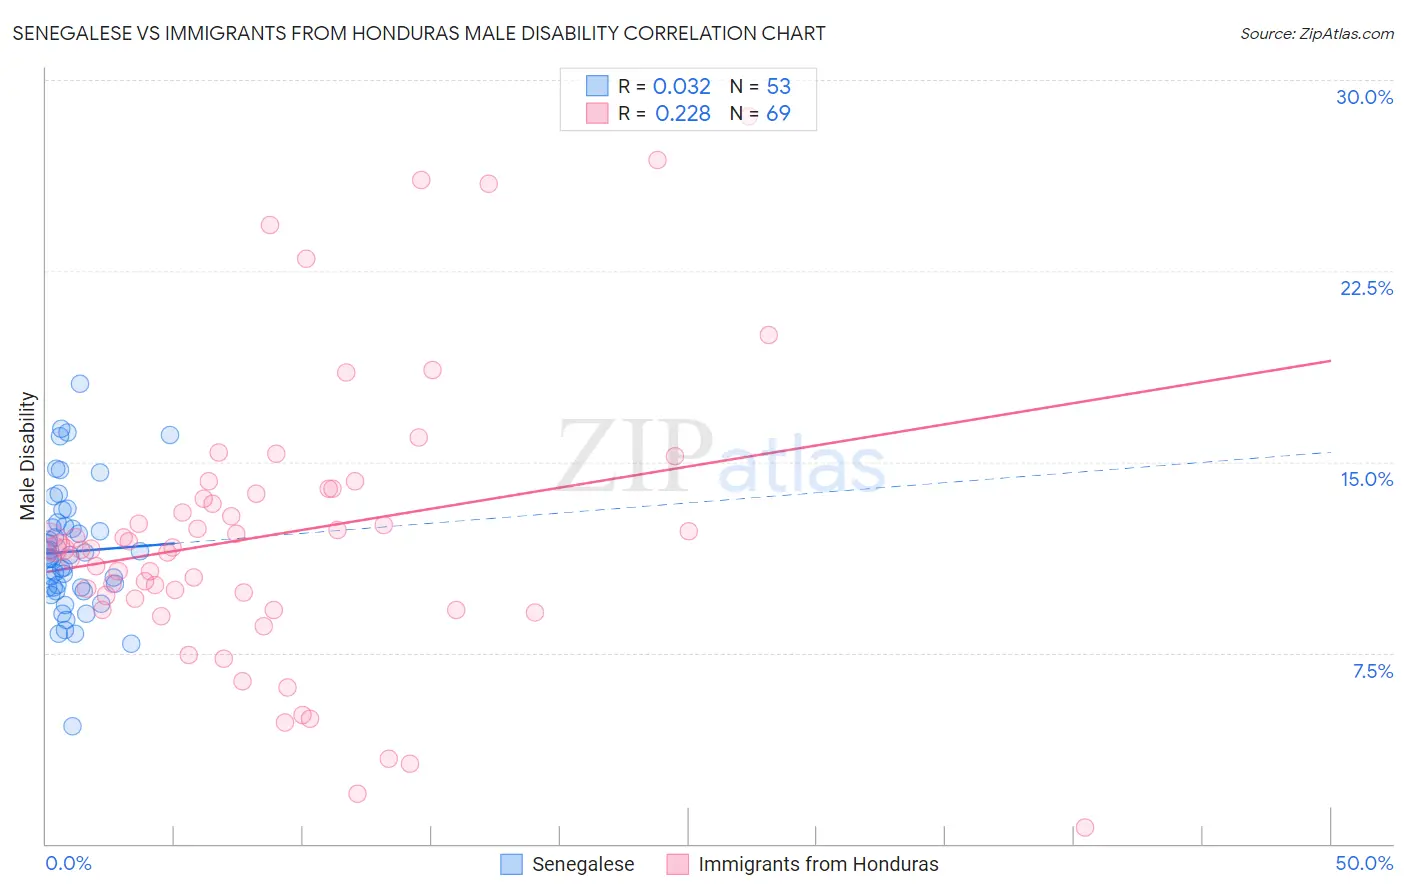
Senegalese vs Immigrants from Honduras Male Disability Correlation Chart
The statistical analysis conducted on geographies consisting of 78,137,196 people shows no correlation between the proportion of Senegalese and percentage of males with a disability in the United States with a correlation coefficient (R) of 0.032 and weighted average of 11.4%. Similarly, the statistical analysis conducted on geographies consisting of 322,552,895 people shows a weak positive correlation between the proportion of Immigrants from Honduras and percentage of males with a disability in the United States with a correlation coefficient (R) of 0.228 and weighted average of 11.2%, a difference of 1.6%.
Male Disability Correlation Summary
| Measurement | Senegalese | Immigrants from Honduras |
| Minimum | 4.6% | 0.65% |
| Maximum | 18.0% | 28.6% |
| Range | 13.4% | 27.9% |
| Mean | 11.5% | 12.2% |
| Median | 11.2% | 11.6% |
| Interquartile 25% (IQ1) | 10.0% | 9.4% |
| Interquartile 75% (IQ3) | 12.5% | 13.8% |
| Interquartile Range (IQR) | 2.5% | 4.4% |
| Standard Deviation (Sample) | 2.5% | 5.6% |
| Standard Deviation (Population) | 2.5% | 5.5% |
Demographics Similar to Senegalese and Immigrants from Honduras by Male Disability
In terms of male disability, the demographic groups most similar to Senegalese are Assyrian/Chaldean/Syriac (11.4%, a difference of 0.0%), Greek (11.4%, a difference of 0.080%), Immigrants from Bosnia and Herzegovina (11.4%, a difference of 0.16%), Immigrants from Netherlands (11.4%, a difference of 0.20%), and Estonian (11.4%, a difference of 0.26%). Similarly, the demographic groups most similar to Immigrants from Honduras are Maltese (11.2%, a difference of 0.070%), Immigrants from Burma/Myanmar (11.2%, a difference of 0.10%), Syrian (11.2%, a difference of 0.12%), Immigrants from Norway (11.3%, a difference of 0.25%), and Australian (11.3%, a difference of 0.36%).
| Demographics | Rating | Rank | Male Disability |
| Immigrants | Burma/Myanmar | 50.4 /100 | #173 | Average 11.2% |
| Maltese | 50.0 /100 | #174 | Average 11.2% |
| Immigrants | Honduras | 48.7 /100 | #175 | Average 11.2% |
| Syrians | 46.6 /100 | #176 | Average 11.2% |
| Immigrants | Norway | 44.2 /100 | #177 | Average 11.3% |
| Australians | 42.2 /100 | #178 | Average 11.3% |
| Immigrants | Caribbean | 41.4 /100 | #179 | Average 11.3% |
| Hondurans | 41.1 /100 | #180 | Average 11.3% |
| Immigrants | Senegal | 34.4 /100 | #181 | Fair 11.3% |
| Immigrants | Belize | 33.7 /100 | #182 | Fair 11.3% |
| Immigrants | Central America | 32.9 /100 | #183 | Fair 11.3% |
| Iraqis | 30.5 /100 | #184 | Fair 11.3% |
| Pakistanis | 30.3 /100 | #185 | Fair 11.3% |
| Immigrants | Zaire | 27.6 /100 | #186 | Fair 11.4% |
| Immigrants | Austria | 27.3 /100 | #187 | Fair 11.4% |
| Estonians | 26.8 /100 | #188 | Fair 11.4% |
| Immigrants | Netherlands | 25.9 /100 | #189 | Fair 11.4% |
| Immigrants | Bosnia and Herzegovina | 25.4 /100 | #190 | Fair 11.4% |
| Senegalese | 23.2 /100 | #191 | Fair 11.4% |
| Assyrians/Chaldeans/Syriacs | 23.2 /100 | #192 | Fair 11.4% |
| Greeks | 22.2 /100 | #193 | Fair 11.4% |