Yup'ik vs Immigrants from Australia Ambulatory Disability
COMPARE
Yup'ik
Immigrants from Australia
Ambulatory Disability
Ambulatory Disability Comparison
Yup'ik
Immigrants from Australia
5.2%
AMBULATORY DISABILITY
100.0/ 100
METRIC RATING
10th/ 347
METRIC RANK
5.5%
AMBULATORY DISABILITY
100.0/ 100
METRIC RATING
32nd/ 347
METRIC RANK
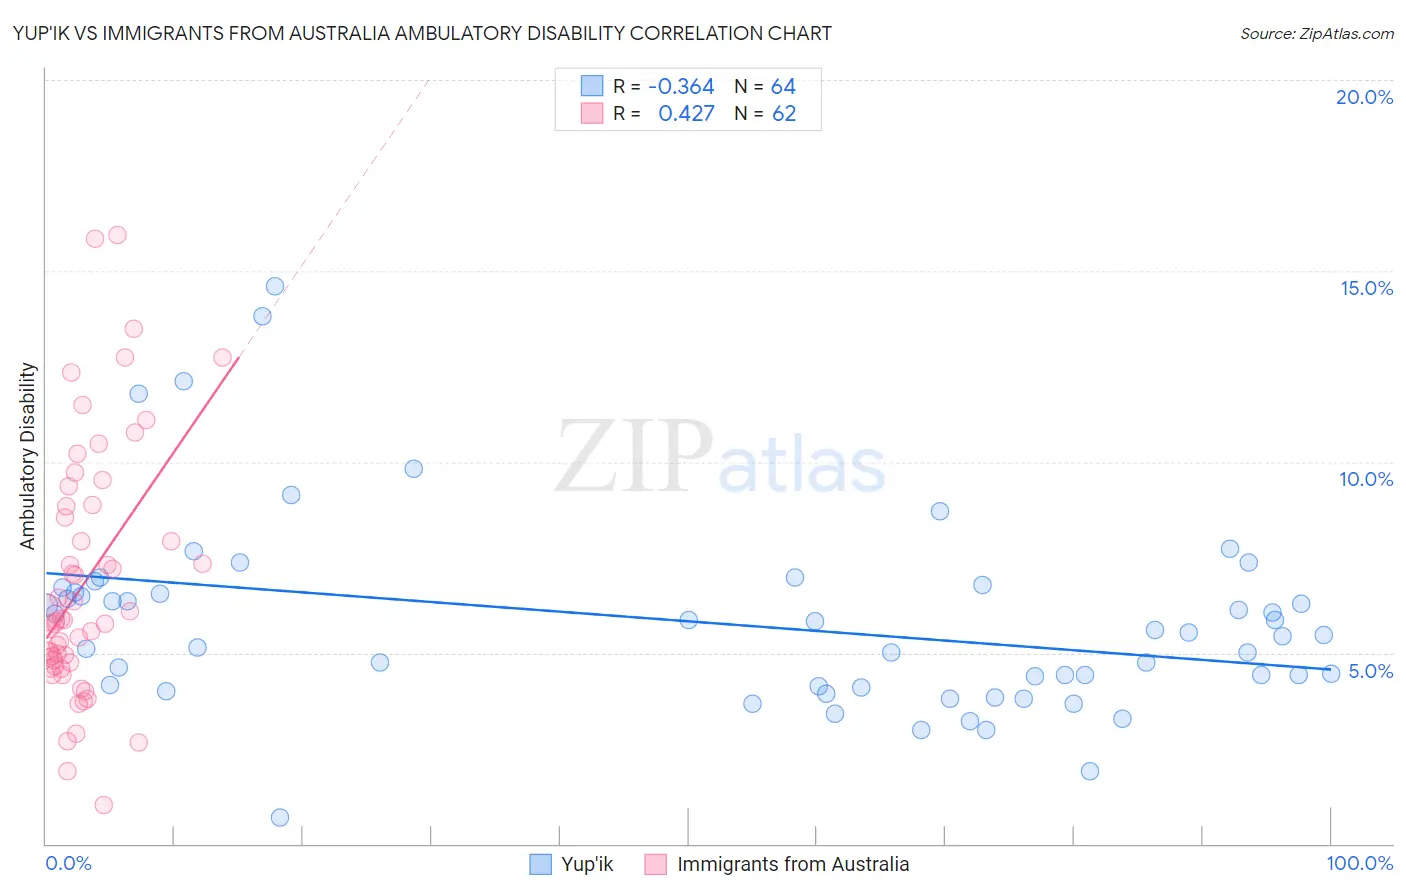
Yup'ik vs Immigrants from Australia Ambulatory Disability Correlation Chart
The statistical analysis conducted on geographies consisting of 39,959,471 people shows a mild negative correlation between the proportion of Yup'ik and percentage of population with ambulatory disability in the United States with a correlation coefficient (R) of -0.364 and weighted average of 5.2%. Similarly, the statistical analysis conducted on geographies consisting of 227,168,976 people shows a moderate positive correlation between the proportion of Immigrants from Australia and percentage of population with ambulatory disability in the United States with a correlation coefficient (R) of 0.427 and weighted average of 5.5%, a difference of 5.8%.
Ambulatory Disability Correlation Summary
| Measurement | Yup'ik | Immigrants from Australia |
| Minimum | 0.68% | 1.0% |
| Maximum | 14.6% | 15.9% |
| Range | 13.9% | 14.9% |
| Mean | 5.8% | 6.8% |
| Median | 5.5% | 5.8% |
| Interquartile 25% (IQ1) | 4.1% | 4.7% |
| Interquartile 75% (IQ3) | 6.6% | 8.9% |
| Interquartile Range (IQR) | 2.5% | 4.1% |
| Standard Deviation (Sample) | 2.5% | 3.3% |
| Standard Deviation (Population) | 2.5% | 3.2% |
Similar Demographics by Ambulatory Disability
Demographics Similar to Yup'ik by Ambulatory Disability
In terms of ambulatory disability, the demographic groups most similar to Yup'ik are Iranian (5.1%, a difference of 0.60%), Immigrants from South Central Asia (5.1%, a difference of 0.97%), Immigrants from Korea (5.2%, a difference of 1.6%), Okinawan (5.3%, a difference of 1.9%), and Bolivian (5.1%, a difference of 2.0%).
| Demographics | Rating | Rank | Ambulatory Disability |
| Thais | 100.0 /100 | #3 | Exceptional 4.9% |
| Immigrants | Taiwan | 100.0 /100 | #4 | Exceptional 4.9% |
| Immigrants | Singapore | 100.0 /100 | #5 | Exceptional 5.0% |
| Immigrants | Bolivia | 100.0 /100 | #6 | Exceptional 5.0% |
| Bolivians | 100.0 /100 | #7 | Exceptional 5.1% |
| Immigrants | South Central Asia | 100.0 /100 | #8 | Exceptional 5.1% |
| Iranians | 100.0 /100 | #9 | Exceptional 5.1% |
| Yup'ik | 100.0 /100 | #10 | Exceptional 5.2% |
| Immigrants | Korea | 100.0 /100 | #11 | Exceptional 5.2% |
| Okinawans | 100.0 /100 | #12 | Exceptional 5.3% |
| Burmese | 100.0 /100 | #13 | Exceptional 5.3% |
| Immigrants | Eastern Asia | 100.0 /100 | #14 | Exceptional 5.3% |
| Immigrants | China | 100.0 /100 | #15 | Exceptional 5.3% |
| Immigrants | Hong Kong | 100.0 /100 | #16 | Exceptional 5.3% |
| Immigrants | Ethiopia | 100.0 /100 | #17 | Exceptional 5.4% |
Demographics Similar to Immigrants from Australia by Ambulatory Disability
In terms of ambulatory disability, the demographic groups most similar to Immigrants from Australia are Immigrants from Pakistan (5.5%, a difference of 0.12%), Immigrants from Venezuela (5.4%, a difference of 0.17%), Immigrants from Turkey (5.4%, a difference of 0.19%), Immigrants from Asia (5.5%, a difference of 0.28%), and Afghan (5.5%, a difference of 0.32%).
| Demographics | Rating | Rank | Ambulatory Disability |
| Zimbabweans | 100.0 /100 | #25 | Exceptional 5.4% |
| Immigrants | Nepal | 100.0 /100 | #26 | Exceptional 5.4% |
| Asians | 100.0 /100 | #27 | Exceptional 5.4% |
| Cambodians | 100.0 /100 | #28 | Exceptional 5.4% |
| Immigrants | Iran | 100.0 /100 | #29 | Exceptional 5.4% |
| Immigrants | Turkey | 100.0 /100 | #30 | Exceptional 5.4% |
| Immigrants | Venezuela | 100.0 /100 | #31 | Exceptional 5.4% |
| Immigrants | Australia | 100.0 /100 | #32 | Exceptional 5.5% |
| Immigrants | Pakistan | 100.0 /100 | #33 | Exceptional 5.5% |
| Immigrants | Asia | 100.0 /100 | #34 | Exceptional 5.5% |
| Afghans | 100.0 /100 | #35 | Exceptional 5.5% |
| Immigrants | Malaysia | 100.0 /100 | #36 | Exceptional 5.5% |
| Turks | 100.0 /100 | #37 | Exceptional 5.5% |
| Cypriots | 100.0 /100 | #38 | Exceptional 5.5% |
| Immigrants | Eritrea | 100.0 /100 | #39 | Exceptional 5.5% |