Yup'ik vs U.S. Virgin Islander Ambulatory Disability
COMPARE
Yup'ik
U.S. Virgin Islander
Ambulatory Disability
Ambulatory Disability Comparison
Yup'ik
U.S. Virgin Islanders
5.2%
AMBULATORY DISABILITY
100.0/ 100
METRIC RATING
10th/ 347
METRIC RANK
6.8%
AMBULATORY DISABILITY
0.0/ 100
METRIC RATING
287th/ 347
METRIC RANK
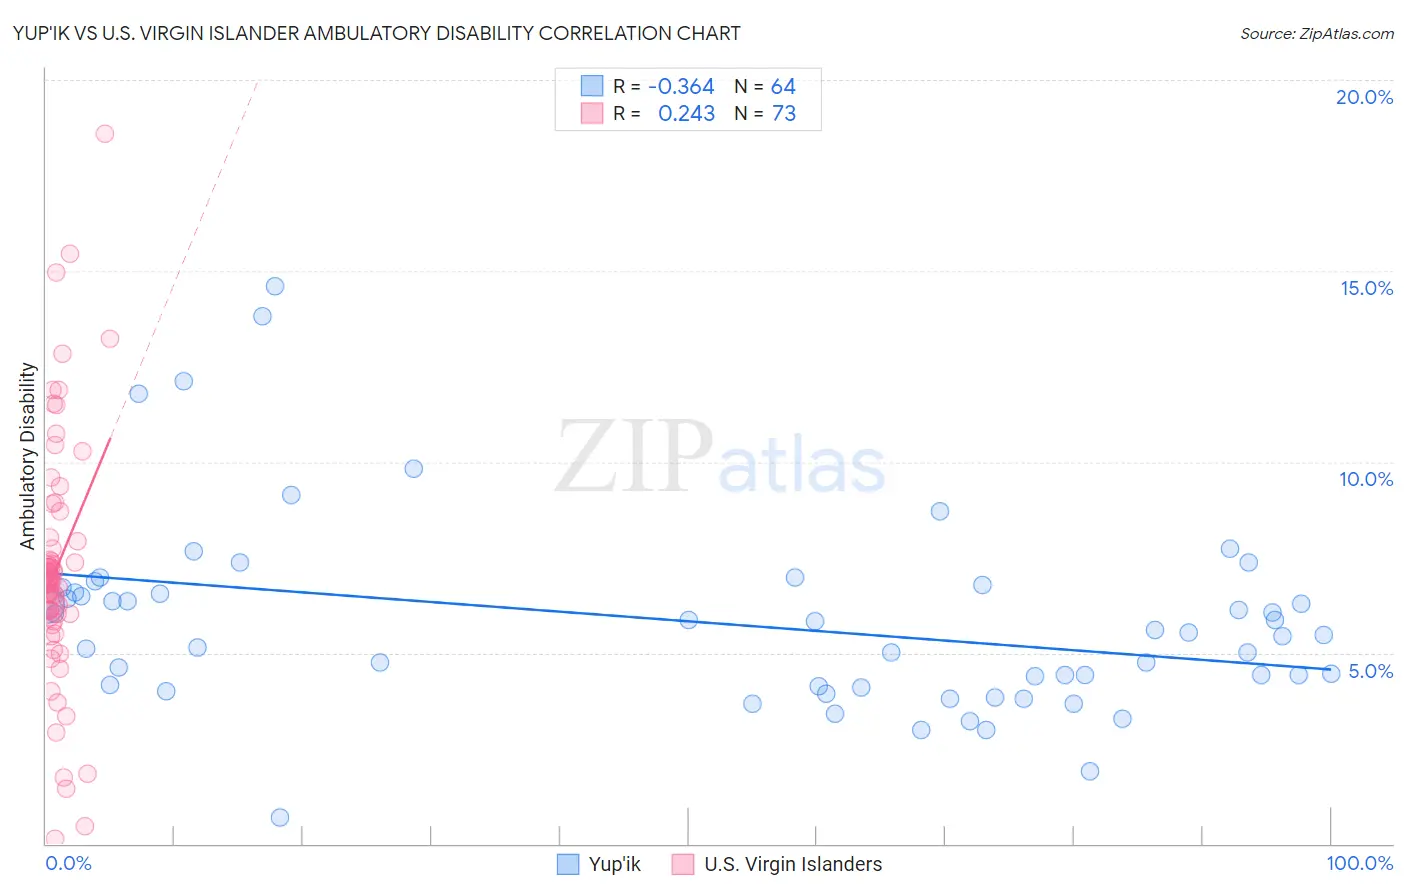
Yup'ik vs U.S. Virgin Islander Ambulatory Disability Correlation Chart
The statistical analysis conducted on geographies consisting of 39,959,471 people shows a mild negative correlation between the proportion of Yup'ik and percentage of population with ambulatory disability in the United States with a correlation coefficient (R) of -0.364 and weighted average of 5.2%. Similarly, the statistical analysis conducted on geographies consisting of 87,521,304 people shows a weak positive correlation between the proportion of U.S. Virgin Islanders and percentage of population with ambulatory disability in the United States with a correlation coefficient (R) of 0.243 and weighted average of 6.8%, a difference of 32.5%.
Ambulatory Disability Correlation Summary
| Measurement | Yup'ik | U.S. Virgin Islander |
| Minimum | 0.68% | 0.13% |
| Maximum | 14.6% | 18.6% |
| Range | 13.9% | 18.5% |
| Mean | 5.8% | 7.2% |
| Median | 5.5% | 6.9% |
| Interquartile 25% (IQ1) | 4.1% | 6.0% |
| Interquartile 75% (IQ3) | 6.6% | 8.0% |
| Interquartile Range (IQR) | 2.5% | 2.0% |
| Standard Deviation (Sample) | 2.5% | 3.2% |
| Standard Deviation (Population) | 2.5% | 3.2% |
Similar Demographics by Ambulatory Disability
Demographics Similar to Yup'ik by Ambulatory Disability
In terms of ambulatory disability, the demographic groups most similar to Yup'ik are Iranian (5.1%, a difference of 0.60%), Immigrants from South Central Asia (5.1%, a difference of 0.97%), Immigrants from Korea (5.2%, a difference of 1.6%), Okinawan (5.3%, a difference of 1.9%), and Bolivian (5.1%, a difference of 2.0%).
| Demographics | Rating | Rank | Ambulatory Disability |
| Thais | 100.0 /100 | #3 | Exceptional 4.9% |
| Immigrants | Taiwan | 100.0 /100 | #4 | Exceptional 4.9% |
| Immigrants | Singapore | 100.0 /100 | #5 | Exceptional 5.0% |
| Immigrants | Bolivia | 100.0 /100 | #6 | Exceptional 5.0% |
| Bolivians | 100.0 /100 | #7 | Exceptional 5.1% |
| Immigrants | South Central Asia | 100.0 /100 | #8 | Exceptional 5.1% |
| Iranians | 100.0 /100 | #9 | Exceptional 5.1% |
| Yup'ik | 100.0 /100 | #10 | Exceptional 5.2% |
| Immigrants | Korea | 100.0 /100 | #11 | Exceptional 5.2% |
| Okinawans | 100.0 /100 | #12 | Exceptional 5.3% |
| Burmese | 100.0 /100 | #13 | Exceptional 5.3% |
| Immigrants | Eastern Asia | 100.0 /100 | #14 | Exceptional 5.3% |
| Immigrants | China | 100.0 /100 | #15 | Exceptional 5.3% |
| Immigrants | Hong Kong | 100.0 /100 | #16 | Exceptional 5.3% |
| Immigrants | Ethiopia | 100.0 /100 | #17 | Exceptional 5.4% |
Demographics Similar to U.S. Virgin Islanders by Ambulatory Disability
In terms of ambulatory disability, the demographic groups most similar to U.S. Virgin Islanders are Nonimmigrants (6.9%, a difference of 0.27%), Yakama (6.8%, a difference of 0.32%), Fijian (6.8%, a difference of 0.36%), Immigrants from Dominica (6.9%, a difference of 0.41%), and Scotch-Irish (6.9%, a difference of 0.44%).
| Demographics | Rating | Rank | Ambulatory Disability |
| Pennsylvania Germans | 0.0 /100 | #280 | Tragic 6.8% |
| Yaqui | 0.0 /100 | #281 | Tragic 6.8% |
| Barbadians | 0.0 /100 | #282 | Tragic 6.8% |
| Immigrants | Barbados | 0.0 /100 | #283 | Tragic 6.8% |
| Immigrants | Jamaica | 0.0 /100 | #284 | Tragic 6.8% |
| Fijians | 0.0 /100 | #285 | Tragic 6.8% |
| Yakama | 0.0 /100 | #286 | Tragic 6.8% |
| U.S. Virgin Islanders | 0.0 /100 | #287 | Tragic 6.8% |
| Immigrants | Nonimmigrants | 0.0 /100 | #288 | Tragic 6.9% |
| Immigrants | Dominica | 0.0 /100 | #289 | Tragic 6.9% |
| Scotch-Irish | 0.0 /100 | #290 | Tragic 6.9% |
| West Indians | 0.0 /100 | #291 | Tragic 6.9% |
| Cheyenne | 0.0 /100 | #292 | Tragic 6.9% |
| Immigrants | St. Vincent and the Grenadines | 0.0 /100 | #293 | Tragic 6.9% |
| Cape Verdeans | 0.0 /100 | #294 | Tragic 6.9% |