Maltese vs Immigrants from Australia Ambulatory Disability

COMPARE

Maltese
Race
Ancestry
AfghanAfricanAlaska NativeAlaskan AthabascanAlbanianAleutAlsatianAmericanApacheArabArapahoArgentineanArmenianAssyrian/Chaldean/SyriacAustralianAustrianBahamianBangladeshiBarbadianBasqueBelgianBelizeanBermudanBhutaneseBlackfeetBolivianBrazilianBritishBritish West IndianBulgarianBurmeseCajunCambodianCanadianCape VerdeanCarpatho RusynCelticCentral AmericanCentral American IndianCherokeeCheyenneChickasawChileanChineseChippewaChoctawColombianColvilleComancheCosta RicanCreeCreekCroatianCrowCubanCypriotCzechCzechoslovakianDanishDelawareDominicanDutchDutch West IndianEastern EuropeanEcuadorianEgyptianEnglishEstonianEthiopianEuropeanFijianFilipinoFinnishFrenchFrench American IndianFrench CanadianGermanGerman RussianGhanaianGreekGuamanian/ChamorroGuatemalanGuyaneseHaitianHmongHonduranHopiHoumaHungarianIcelanderIndian (Asian)IndonesianInupiatIranianIraqiIrishIroquoisIsraeliItalianJamaicanJapaneseJordanianKenyanKiowaKoreanLaotianLatvianLebaneseLiberianLithuanianLumbeeLuxembourgerMacedonianMalaysianMalteseMarshalleseMenomineeMexicanMexican American IndianMongolianMoroccanNative HawaiianNavajoNepaleseNew ZealanderNicaraguanNigerianNorthern EuropeanNorwegianOkinawanOsageOttawaPaiutePakistaniPalestinianPanamanianParaguayanPennsylvania GermanPeruvianPimaPolishPortuguesePotawatomiPuebloPuerto RicanPuget Sound SalishRomanianRussianSalvadoranSamoanScandinavianScotch-IrishScottishSeminoleSenegaleseSerbianShoshoneSierra LeoneanSiouxSlavicSlovakSloveneSomaliSouth AfricanSouth AmericanSouth American IndianSoviet UnionSpaniardSpanishSpanish AmericanSpanish American IndianSri LankanSubsaharan AfricanSudaneseSwedishSwissSyrianTaiwaneseThaiTlingit-HaidaTohono O'OdhamTonganTrinidadian and TobagonianTsimshianTurkishU.S. Virgin IslanderUgandanUkrainianUruguayanUteVenezuelanVietnameseWelshWest IndianYakamaYaquiYugoslavianYumanYup'ikZimbabwean
Immigration
NonimmigrantsImmigrantsAfghanistanAfricaAlbaniaArgentinaArmeniaAsiaAustriaBahamasBangladeshBarbadosBelarusBelgiumBelizeBoliviaBosnia and HerzegovinaBrazilBulgariaBurma/MyanmarCabo VerdeCambodiaCameroonCanadaCaribbeanCentral AmericaChileChinaColombiaCongoCosta RicaCroatiaCubaCzechoslovakiaDenmarkDominicaDominican RepublicEastern AfricaEastern AsiaEastern EuropeEcuadorEgyptEl SalvadorEnglandEritreaEthiopiaEuropeFijiFranceGermanyGhanaGreeceGrenadaGuatemalaGuyanaHaitiHondurasHong KongHungaryIndiaIndonesiaIranIraqIrelandIsraelItalyJamaicaJapanJordanKazakhstanKenyaKoreaKuwaitLaosLatin AmericaLatviaLebanonLiberiaLithuaniaMalaysiaMexicoMicronesiaMiddle AfricaMoldovaMoroccoNepalNetherlandsNicaraguaNigeriaNorth AmericaNorth MacedoniaNorthern AfricaNorthern EuropeNorwayOceaniaPakistanPanamaPeruPhilippinesPolandPortugalRomaniaRussiaSaudi ArabiaScotlandSenegalSerbiaSierra LeoneSingaporeSomaliaSouth AfricaSouth AmericaSouth Central AsiaSouth Eastern AsiaSouthern EuropeSpainSri LankaSt. Vincent and the GrenadinesSudanSwedenSwitzerlandSyriaTaiwanThailandTrinidad and TobagoTurkeyUgandaUkraineUruguayUzbekistanVenezuelaVietnamWest IndiesWestern AfricaWestern AsiaWestern EuropeYemenZaireZimbabweAzores
Immigrants from Australia
Race
Ancestry
AfghanAfricanAlaska NativeAlaskan AthabascanAlbanianAleutAlsatianAmericanApacheArabArapahoArgentineanArmenianAssyrian/Chaldean/SyriacAustralianAustrianBahamianBangladeshiBarbadianBasqueBelgianBelizeanBermudanBhutaneseBlackfeetBolivianBrazilianBritishBritish West IndianBulgarianBurmeseCajunCambodianCanadianCape VerdeanCarpatho RusynCelticCentral AmericanCentral American IndianCherokeeCheyenneChickasawChileanChineseChippewaChoctawColombianColvilleComancheCosta RicanCreeCreekCroatianCrowCubanCypriotCzechCzechoslovakianDanishDelawareDominicanDutchDutch West IndianEastern EuropeanEcuadorianEgyptianEnglishEstonianEthiopianEuropeanFijianFilipinoFinnishFrenchFrench American IndianFrench CanadianGermanGerman RussianGhanaianGreekGuamanian/ChamorroGuatemalanGuyaneseHaitianHmongHonduranHopiHoumaHungarianIcelanderIndian (Asian)IndonesianInupiatIranianIraqiIrishIroquoisIsraeliItalianJamaicanJapaneseJordanianKenyanKiowaKoreanLaotianLatvianLebaneseLiberianLithuanianLumbeeLuxembourgerMacedonianMalaysianMarshalleseMenomineeMexicanMexican American IndianMongolianMoroccanNative HawaiianNavajoNepaleseNew ZealanderNicaraguanNigerianNorthern EuropeanNorwegianOkinawanOsageOttawaPaiutePakistaniPalestinianPanamanianParaguayanPennsylvania GermanPeruvianPimaPolishPortuguesePotawatomiPuebloPuerto RicanPuget Sound SalishRomanianRussianSalvadoranSamoanScandinavianScotch-IrishScottishSeminoleSenegaleseSerbianShoshoneSierra LeoneanSiouxSlavicSlovakSloveneSomaliSouth AfricanSouth AmericanSouth American IndianSoviet UnionSpaniardSpanishSpanish AmericanSpanish American IndianSri LankanSubsaharan AfricanSudaneseSwedishSwissSyrianTaiwaneseThaiTlingit-HaidaTohono O'OdhamTonganTrinidadian and TobagonianTsimshianTurkishU.S. Virgin IslanderUgandanUkrainianUruguayanUteVenezuelanVietnameseWelshWest IndianYakamaYaquiYugoslavianYumanYup'ikZimbabwean
Immigration
NonimmigrantsImmigrantsAfghanistanAfricaAlbaniaArgentinaArmeniaAsiaAustraliaAustriaBahamasBangladeshBarbadosBelarusBelgiumBelizeBoliviaBosnia and HerzegovinaBrazilBulgariaBurma/MyanmarCabo VerdeCambodiaCameroonCanadaCaribbeanCentral AmericaChileChinaColombiaCongoCosta RicaCroatiaCubaCzechoslovakiaDenmarkDominicaDominican RepublicEastern AfricaEastern AsiaEastern EuropeEcuadorEgyptEl SalvadorEnglandEritreaEthiopiaEuropeFijiFranceGermanyGhanaGreeceGrenadaGuatemalaGuyanaHaitiHondurasHong KongHungaryIndiaIndonesiaIranIraqIrelandIsraelItalyJamaicaJapanJordanKazakhstanKenyaKoreaKuwaitLaosLatin AmericaLatviaLebanonLiberiaLithuaniaMalaysiaMexicoMicronesiaMiddle AfricaMoldovaMoroccoNepalNetherlandsNicaraguaNigeriaNorth AmericaNorth MacedoniaNorthern AfricaNorthern EuropeNorwayOceaniaPakistanPanamaPeruPhilippinesPolandPortugalRomaniaRussiaSaudi ArabiaScotlandSenegalSerbiaSierra LeoneSingaporeSomaliaSouth AfricaSouth AmericaSouth Central AsiaSouth Eastern AsiaSouthern EuropeSpainSri LankaSt. Vincent and the GrenadinesSudanSwedenSwitzerlandSyriaTaiwanThailandTrinidad and TobagoTurkeyUgandaUkraineUruguayUzbekistanVenezuelaVietnamWest IndiesWestern AfricaWestern AsiaWestern EuropeYemenZaireZimbabweAzores
Ambulatory Disability
Income
Poverty
Unemployment
Labor Participation
Family Structure
Vehicle Availability
Education Level
Disability

Ambulatory Disability Comparison

Maltese

Immigrants from Australia

Excellent
Exceptional
6.0%
AMBULATORY DISABILITY
81.6/ 100
METRIC RATING
150th/ 347
METRIC RANK
5.5%
AMBULATORY DISABILITY
100.0/ 100
METRIC RATING
32nd/ 347
METRIC RANK

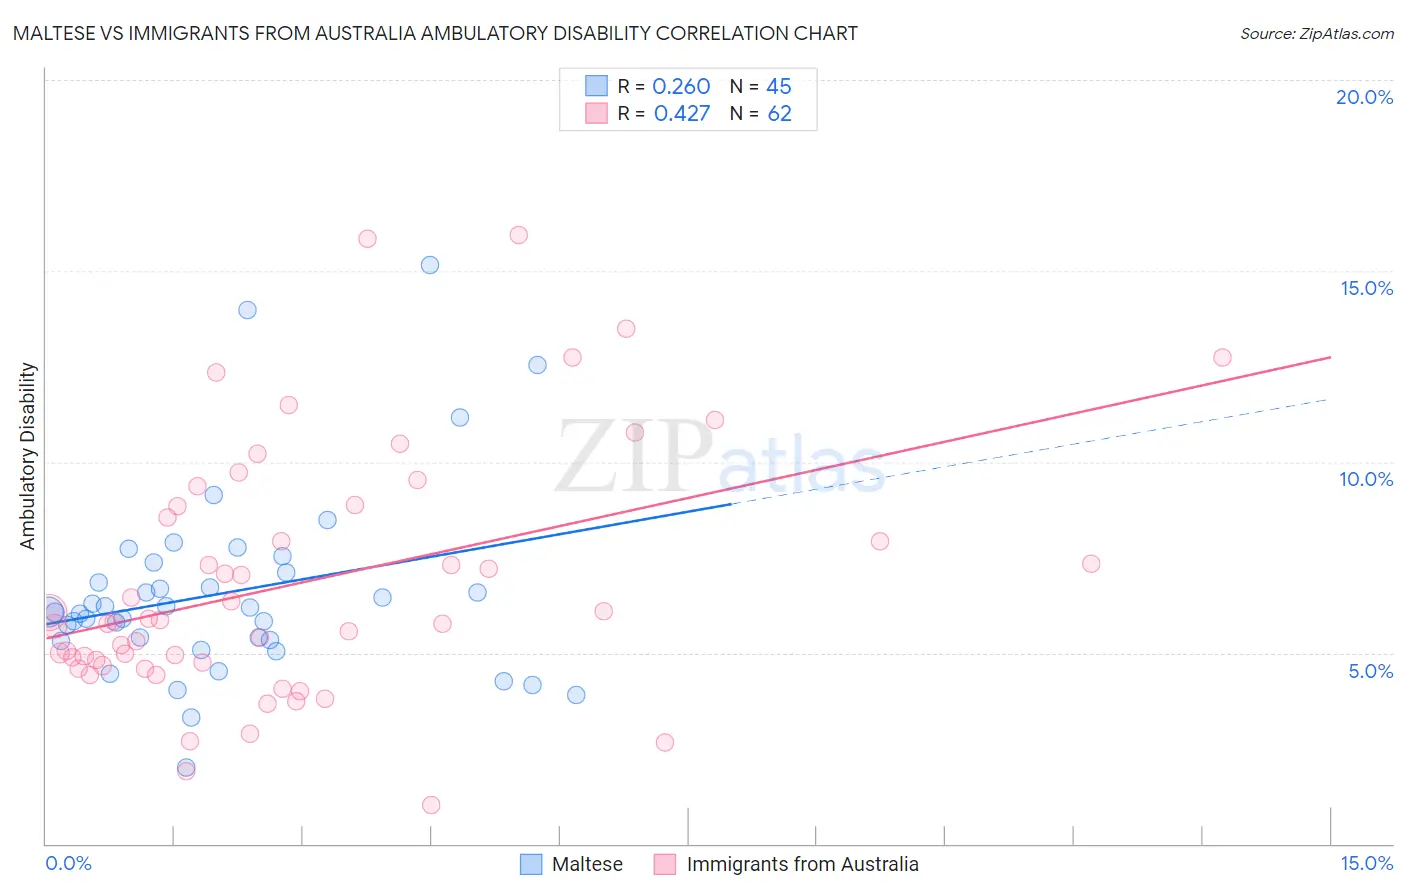
Maltese vs Immigrants from Australia Ambulatory Disability Correlation Chart

The statistical analysis conducted on geographies consisting of 126,465,300 people shows a weak positive correlation between the proportion of Maltese and percentage of population with ambulatory disability in the United States with a correlation coefficient (R) of 0.260 and weighted average of 6.0%. Similarly, the statistical analysis conducted on geographies consisting of 227,168,976 people shows a moderate positive correlation between the proportion of Immigrants from Australia and percentage of population with ambulatory disability in the United States with a correlation coefficient (R) of 0.427 and weighted average of 5.5%, a difference of 9.9%.
Maltese vs Immigrants from Australia Ambulatory Disability

Ambulatory Disability Correlation Summary

MeasurementMalteseImmigrants from Australia
Minimum2.0%1.0%
Maximum15.2%15.9%
Range13.2%14.9%
Mean6.6%6.8%
Median6.1%5.8%
Interquartile 25% (IQ1)5.3%4.7%
Interquartile 75% (IQ3)7.2%8.9%
Interquartile Range (IQR)1.9%4.1%
Standard Deviation (Sample)2.5%3.3%
Standard Deviation (Population)2.5%3.2%

Similar Demographics by Ambulatory Disability

Demographics Similar to Maltese by Ambulatory Disability

In terms of ambulatory disability, the demographic groups most similar to Maltese are Lithuanian (6.0%, a difference of 0.020%), Immigrants from Eastern Europe (6.0%, a difference of 0.030%), Immigrants from Moldova (6.0%, a difference of 0.070%), Pakistani (6.0%, a difference of 0.080%), and Immigrants from Greece (6.0%, a difference of 0.080%).
DemographicsRating | RankAmbulatory Disability
Romanians
82.9
/100
|
#143
Excellent
6.0%
Macedonians
82.8
/100
|
#144
Excellent
6.0%
Pakistanis
82.5
/100
|
#145
Excellent
6.0%
Immigrants | Greece
82.5
/100
|
#146
Excellent
6.0%
Immigrants | Moldova
82.4
/100
|
#147
Excellent
6.0%
Immigrants | Eastern Europe
82.0
/100
|
#148
Excellent
6.0%
Lithuanians
81.9
/100
|
#149
Excellent
6.0%
Maltese
81.6
/100
|
#150
Excellent
6.0%
Greeks
79.6
/100
|
#151
Good
6.0%
Immigrants | Austria
78.8
/100
|
#152
Good
6.0%
Syrians
75.5
/100
|
#153
Good
6.0%
Immigrants | Croatia
75.1
/100
|
#154
Good
6.0%
Immigrants | Scotland
72.1
/100
|
#155
Good
6.0%
Northern Europeans
71.8
/100
|
#156
Good
6.0%
Ghanaians
71.3
/100
|
#157
Good
6.0%

Demographics Similar to Immigrants from Australia by Ambulatory Disability

In terms of ambulatory disability, the demographic groups most similar to Immigrants from Australia are Immigrants from Pakistan (5.5%, a difference of 0.12%), Immigrants from Venezuela (5.4%, a difference of 0.17%), Immigrants from Turkey (5.4%, a difference of 0.19%), Immigrants from Asia (5.5%, a difference of 0.28%), and Afghan (5.5%, a difference of 0.32%).
DemographicsRating | RankAmbulatory Disability
Zimbabweans
100.0
/100
|
#25
Exceptional
5.4%
Immigrants | Nepal
100.0
/100
|
#26
Exceptional
5.4%
Asians
100.0
/100
|
#27
Exceptional
5.4%
Cambodians
100.0
/100
|
#28
Exceptional
5.4%
Immigrants | Iran
100.0
/100
|
#29
Exceptional
5.4%
Immigrants | Turkey
100.0
/100
|
#30
Exceptional
5.4%
Immigrants | Venezuela
100.0
/100
|
#31
Exceptional
5.4%
Immigrants | Australia
100.0
/100
|
#32
Exceptional
5.5%
Immigrants | Pakistan
100.0
/100
|
#33
Exceptional
5.5%
Immigrants | Asia
100.0
/100
|
#34
Exceptional
5.5%
Afghans
100.0
/100
|
#35
Exceptional
5.5%
Immigrants | Malaysia
100.0
/100
|
#36
Exceptional
5.5%
Turks
100.0
/100
|
#37
Exceptional
5.5%
Cypriots
100.0
/100
|
#38
Exceptional
5.5%
Immigrants | Eritrea
100.0
/100
|
#39
Exceptional
5.5%