Yup'ik vs Immigrants from Panama Ambulatory Disability
COMPARE
Yup'ik
Immigrants from Panama
Ambulatory Disability
Ambulatory Disability Comparison
Yup'ik
Immigrants from Panama
5.2%
AMBULATORY DISABILITY
100.0/ 100
METRIC RATING
10th/ 347
METRIC RANK
6.5%
AMBULATORY DISABILITY
1.5/ 100
METRIC RATING
244th/ 347
METRIC RANK
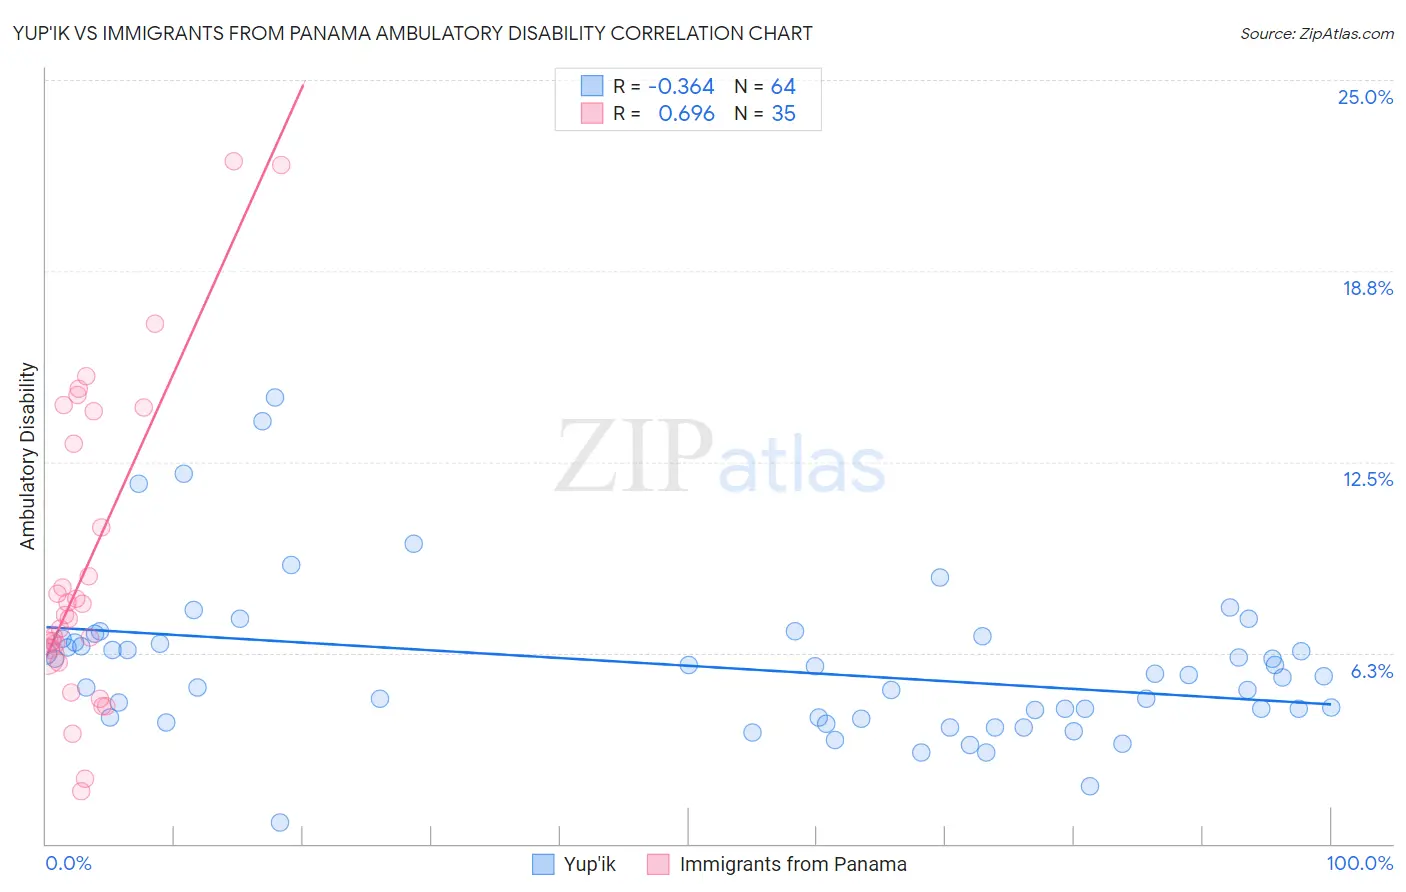
Yup'ik vs Immigrants from Panama Ambulatory Disability Correlation Chart
The statistical analysis conducted on geographies consisting of 39,959,471 people shows a mild negative correlation between the proportion of Yup'ik and percentage of population with ambulatory disability in the United States with a correlation coefficient (R) of -0.364 and weighted average of 5.2%. Similarly, the statistical analysis conducted on geographies consisting of 221,176,077 people shows a significant positive correlation between the proportion of Immigrants from Panama and percentage of population with ambulatory disability in the United States with a correlation coefficient (R) of 0.696 and weighted average of 6.5%, a difference of 25.2%.
Ambulatory Disability Correlation Summary
| Measurement | Yup'ik | Immigrants from Panama |
| Minimum | 0.68% | 1.7% |
| Maximum | 14.6% | 22.3% |
| Range | 13.9% | 20.6% |
| Mean | 5.8% | 9.2% |
| Median | 5.5% | 7.5% |
| Interquartile 25% (IQ1) | 4.1% | 6.1% |
| Interquartile 75% (IQ3) | 6.6% | 14.2% |
| Interquartile Range (IQR) | 2.5% | 8.0% |
| Standard Deviation (Sample) | 2.5% | 5.1% |
| Standard Deviation (Population) | 2.5% | 5.1% |
Similar Demographics by Ambulatory Disability
Demographics Similar to Yup'ik by Ambulatory Disability
In terms of ambulatory disability, the demographic groups most similar to Yup'ik are Iranian (5.1%, a difference of 0.60%), Immigrants from South Central Asia (5.1%, a difference of 0.97%), Immigrants from Korea (5.2%, a difference of 1.6%), Okinawan (5.3%, a difference of 1.9%), and Bolivian (5.1%, a difference of 2.0%).
| Demographics | Rating | Rank | Ambulatory Disability |
| Thais | 100.0 /100 | #3 | Exceptional 4.9% |
| Immigrants | Taiwan | 100.0 /100 | #4 | Exceptional 4.9% |
| Immigrants | Singapore | 100.0 /100 | #5 | Exceptional 5.0% |
| Immigrants | Bolivia | 100.0 /100 | #6 | Exceptional 5.0% |
| Bolivians | 100.0 /100 | #7 | Exceptional 5.1% |
| Immigrants | South Central Asia | 100.0 /100 | #8 | Exceptional 5.1% |
| Iranians | 100.0 /100 | #9 | Exceptional 5.1% |
| Yup'ik | 100.0 /100 | #10 | Exceptional 5.2% |
| Immigrants | Korea | 100.0 /100 | #11 | Exceptional 5.2% |
| Okinawans | 100.0 /100 | #12 | Exceptional 5.3% |
| Burmese | 100.0 /100 | #13 | Exceptional 5.3% |
| Immigrants | Eastern Asia | 100.0 /100 | #14 | Exceptional 5.3% |
| Immigrants | China | 100.0 /100 | #15 | Exceptional 5.3% |
| Immigrants | Hong Kong | 100.0 /100 | #16 | Exceptional 5.3% |
| Immigrants | Ethiopia | 100.0 /100 | #17 | Exceptional 5.4% |
Demographics Similar to Immigrants from Panama by Ambulatory Disability
In terms of ambulatory disability, the demographic groups most similar to Immigrants from Panama are German (6.5%, a difference of 0.0%), Spaniard (6.5%, a difference of 0.020%), Tlingit-Haida (6.5%, a difference of 0.030%), Immigrants from Haiti (6.5%, a difference of 0.050%), and Armenian (6.5%, a difference of 0.050%).
| Demographics | Rating | Rank | Ambulatory Disability |
| Immigrants | Germany | 1.8 /100 | #237 | Tragic 6.4% |
| Haitians | 1.8 /100 | #238 | Tragic 6.4% |
| Senegalese | 1.7 /100 | #239 | Tragic 6.4% |
| Immigrants | Senegal | 1.7 /100 | #240 | Tragic 6.4% |
| Immigrants | Haiti | 1.6 /100 | #241 | Tragic 6.5% |
| Spaniards | 1.6 /100 | #242 | Tragic 6.5% |
| Germans | 1.5 /100 | #243 | Tragic 6.5% |
| Immigrants | Panama | 1.5 /100 | #244 | Tragic 6.5% |
| Tlingit-Haida | 1.5 /100 | #245 | Tragic 6.5% |
| Armenians | 1.5 /100 | #246 | Tragic 6.5% |
| Immigrants | Cuba | 1.4 /100 | #247 | Tragic 6.5% |
| Immigrants | Portugal | 1.4 /100 | #248 | Tragic 6.5% |
| Native Hawaiians | 1.1 /100 | #249 | Tragic 6.5% |
| Chinese | 1.0 /100 | #250 | Tragic 6.5% |
| Hawaiians | 0.9 /100 | #251 | Tragic 6.5% |