Yup'ik vs Immigrants from Morocco Ambulatory Disability
COMPARE
Yup'ik
Immigrants from Morocco
Ambulatory Disability
Ambulatory Disability Comparison
Yup'ik
Immigrants from Morocco
5.2%
AMBULATORY DISABILITY
100.0/ 100
METRIC RATING
10th/ 347
METRIC RANK
5.8%
AMBULATORY DISABILITY
97.3/ 100
METRIC RATING
106th/ 347
METRIC RANK
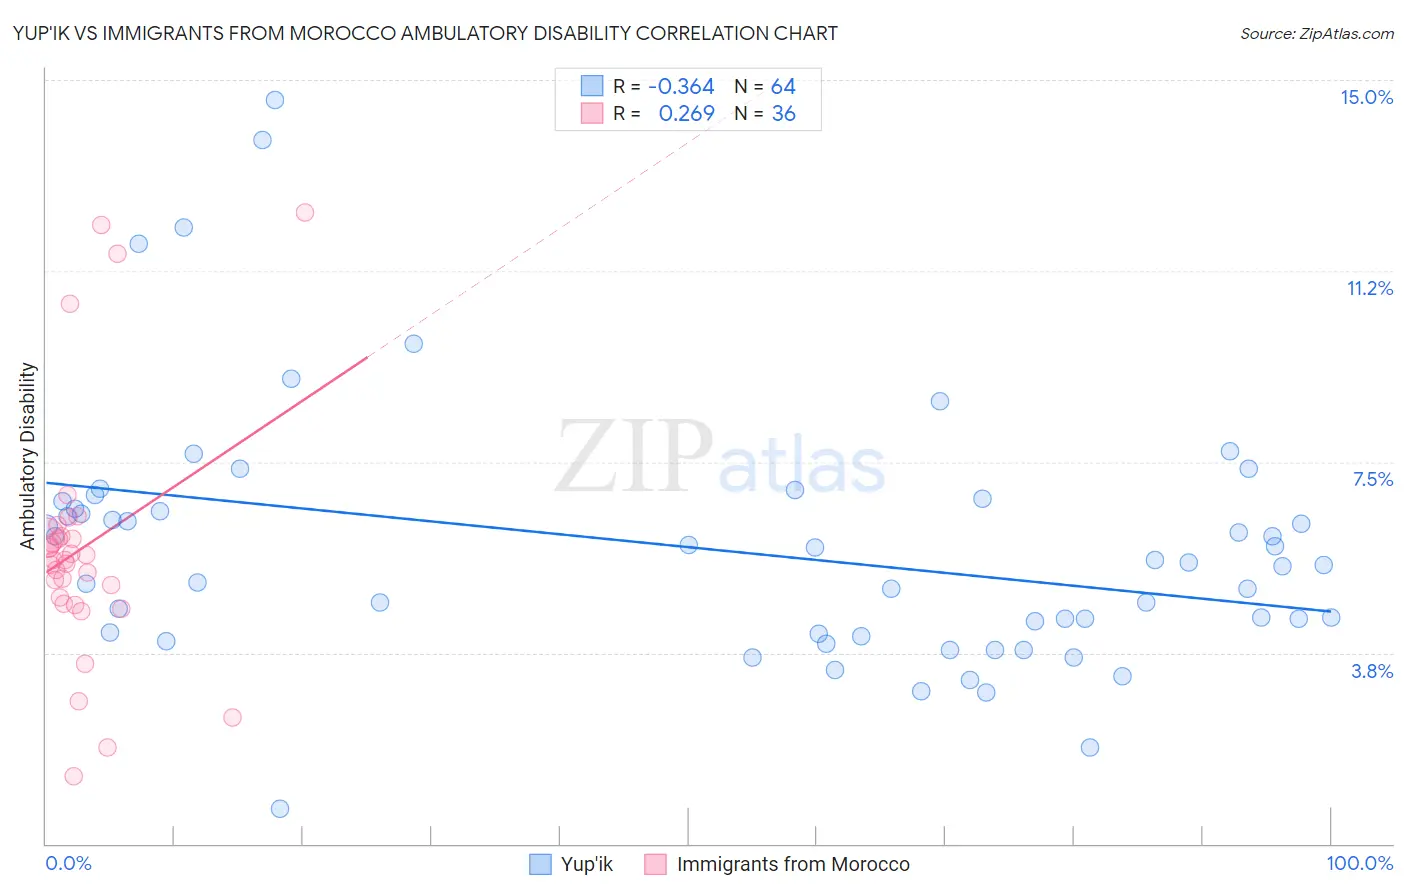
Yup'ik vs Immigrants from Morocco Ambulatory Disability Correlation Chart
The statistical analysis conducted on geographies consisting of 39,959,471 people shows a mild negative correlation between the proportion of Yup'ik and percentage of population with ambulatory disability in the United States with a correlation coefficient (R) of -0.364 and weighted average of 5.2%. Similarly, the statistical analysis conducted on geographies consisting of 178,910,370 people shows a weak positive correlation between the proportion of Immigrants from Morocco and percentage of population with ambulatory disability in the United States with a correlation coefficient (R) of 0.269 and weighted average of 5.8%, a difference of 13.0%.
Ambulatory Disability Correlation Summary
| Measurement | Yup'ik | Immigrants from Morocco |
| Minimum | 0.68% | 1.3% |
| Maximum | 14.6% | 12.4% |
| Range | 13.9% | 11.1% |
| Mean | 5.8% | 5.8% |
| Median | 5.5% | 5.6% |
| Interquartile 25% (IQ1) | 4.1% | 4.8% |
| Interquartile 75% (IQ3) | 6.6% | 6.0% |
| Interquartile Range (IQR) | 2.5% | 1.3% |
| Standard Deviation (Sample) | 2.5% | 2.5% |
| Standard Deviation (Population) | 2.5% | 2.4% |
Similar Demographics by Ambulatory Disability
Demographics Similar to Yup'ik by Ambulatory Disability
In terms of ambulatory disability, the demographic groups most similar to Yup'ik are Iranian (5.1%, a difference of 0.60%), Immigrants from South Central Asia (5.1%, a difference of 0.97%), Immigrants from Korea (5.2%, a difference of 1.6%), Okinawan (5.3%, a difference of 1.9%), and Bolivian (5.1%, a difference of 2.0%).
| Demographics | Rating | Rank | Ambulatory Disability |
| Thais | 100.0 /100 | #3 | Exceptional 4.9% |
| Immigrants | Taiwan | 100.0 /100 | #4 | Exceptional 4.9% |
| Immigrants | Singapore | 100.0 /100 | #5 | Exceptional 5.0% |
| Immigrants | Bolivia | 100.0 /100 | #6 | Exceptional 5.0% |
| Bolivians | 100.0 /100 | #7 | Exceptional 5.1% |
| Immigrants | South Central Asia | 100.0 /100 | #8 | Exceptional 5.1% |
| Iranians | 100.0 /100 | #9 | Exceptional 5.1% |
| Yup'ik | 100.0 /100 | #10 | Exceptional 5.2% |
| Immigrants | Korea | 100.0 /100 | #11 | Exceptional 5.2% |
| Okinawans | 100.0 /100 | #12 | Exceptional 5.3% |
| Burmese | 100.0 /100 | #13 | Exceptional 5.3% |
| Immigrants | Eastern Asia | 100.0 /100 | #14 | Exceptional 5.3% |
| Immigrants | China | 100.0 /100 | #15 | Exceptional 5.3% |
| Immigrants | Hong Kong | 100.0 /100 | #16 | Exceptional 5.3% |
| Immigrants | Ethiopia | 100.0 /100 | #17 | Exceptional 5.4% |
Demographics Similar to Immigrants from Morocco by Ambulatory Disability
In terms of ambulatory disability, the demographic groups most similar to Immigrants from Morocco are Uruguayan (5.8%, a difference of 0.050%), Immigrants from Czechoslovakia (5.8%, a difference of 0.070%), Colombian (5.8%, a difference of 0.070%), Immigrants from Netherlands (5.8%, a difference of 0.080%), and New Zealander (5.8%, a difference of 0.18%).
| Demographics | Rating | Rank | Ambulatory Disability |
| Immigrants | Northern Europe | 98.2 /100 | #99 | Exceptional 5.8% |
| Immigrants | Serbia | 97.9 /100 | #100 | Exceptional 5.8% |
| Immigrants | South America | 97.9 /100 | #101 | Exceptional 5.8% |
| Immigrants | Kenya | 97.8 /100 | #102 | Exceptional 5.8% |
| Immigrants | Romania | 97.7 /100 | #103 | Exceptional 5.8% |
| New Zealanders | 97.6 /100 | #104 | Exceptional 5.8% |
| Immigrants | Czechoslovakia | 97.4 /100 | #105 | Exceptional 5.8% |
| Immigrants | Morocco | 97.3 /100 | #106 | Exceptional 5.8% |
| Uruguayans | 97.2 /100 | #107 | Exceptional 5.8% |
| Colombians | 97.2 /100 | #108 | Exceptional 5.8% |
| Immigrants | Netherlands | 97.1 /100 | #109 | Exceptional 5.8% |
| Immigrants | Colombia | 96.7 /100 | #110 | Exceptional 5.8% |
| Danes | 96.6 /100 | #111 | Exceptional 5.8% |
| South Africans | 96.3 /100 | #112 | Exceptional 5.9% |
| Immigrants | Uruguay | 95.6 /100 | #113 | Exceptional 5.9% |