Yuman vs West Indian Nursery School
COMPARE
Yuman
West Indian
Nursery School
Nursery School Comparison
Yuman
West Indians
97.9%
NURSERY SCHOOL
25.7/ 100
METRIC RATING
197th/ 347
METRIC RANK
97.5%
NURSERY SCHOOL
0.3/ 100
METRIC RATING
268th/ 347
METRIC RANK
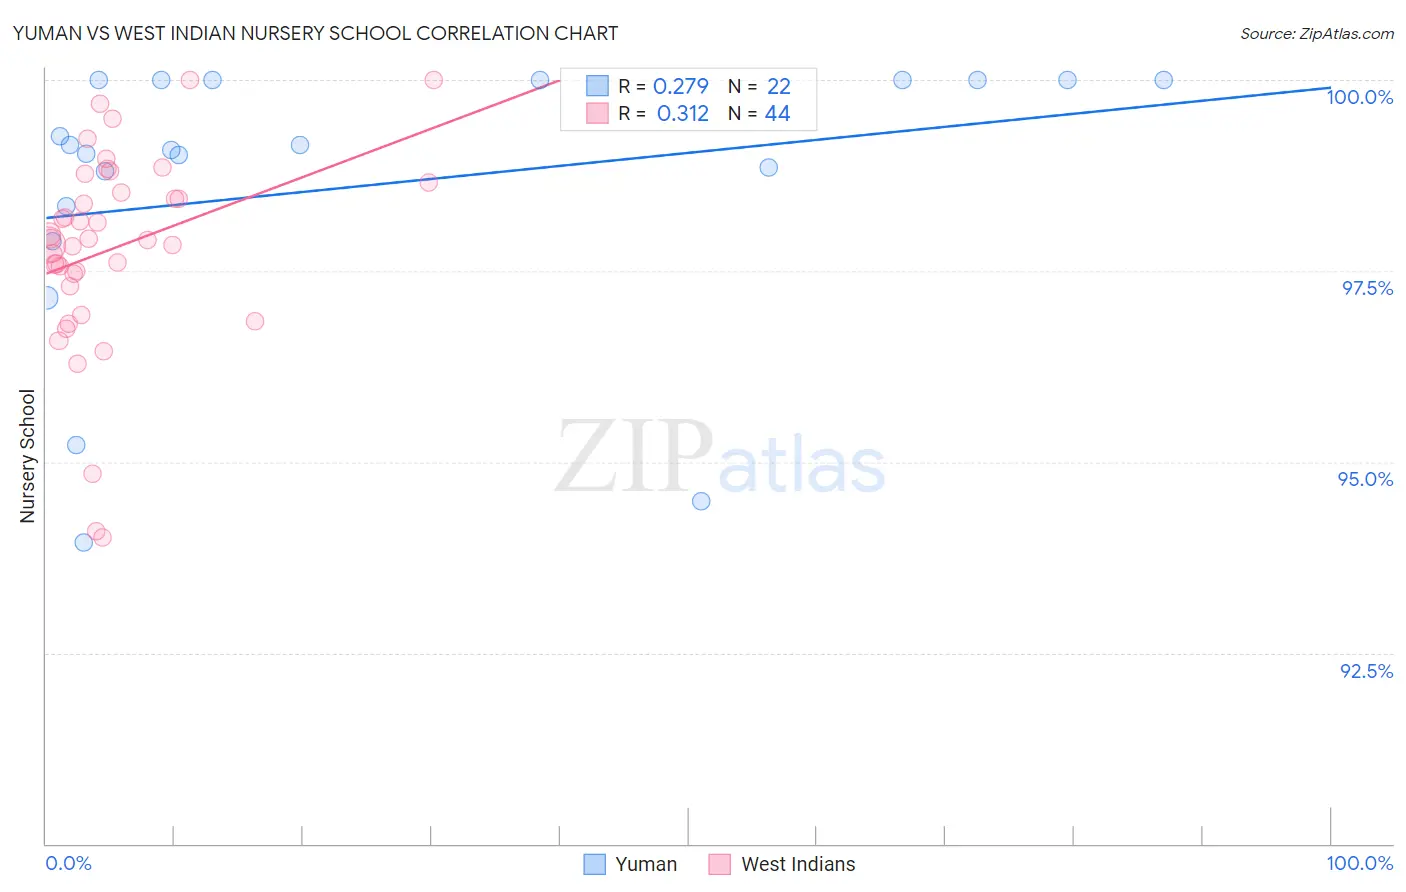
Yuman vs West Indian Nursery School Correlation Chart
The statistical analysis conducted on geographies consisting of 40,696,229 people shows a weak positive correlation between the proportion of Yuman and percentage of population with at least nursery school education in the United States with a correlation coefficient (R) of 0.279 and weighted average of 97.9%. Similarly, the statistical analysis conducted on geographies consisting of 254,063,654 people shows a mild positive correlation between the proportion of West Indians and percentage of population with at least nursery school education in the United States with a correlation coefficient (R) of 0.312 and weighted average of 97.5%, a difference of 0.37%.
Nursery School Correlation Summary
| Measurement | Yuman | West Indian |
| Minimum | 93.9% | 94.0% |
| Maximum | 100.0% | 100.0% |
| Range | 6.1% | 6.0% |
| Mean | 98.6% | 97.8% |
| Median | 99.1% | 97.9% |
| Interquartile 25% (IQ1) | 98.3% | 97.4% |
| Interquartile 75% (IQ3) | 100.0% | 98.6% |
| Interquartile Range (IQR) | 1.7% | 1.2% |
| Standard Deviation (Sample) | 1.8% | 1.3% |
| Standard Deviation (Population) | 1.8% | 1.3% |
Similar Demographics by Nursery School
Demographics Similar to Yuman by Nursery School
In terms of nursery school, the demographic groups most similar to Yuman are Guamanian/Chamorro (97.9%, a difference of 0.0%), Black/African American (97.9%, a difference of 0.010%), Paraguayan (97.9%, a difference of 0.010%), Mongolian (97.9%, a difference of 0.010%), and Hawaiian (97.9%, a difference of 0.010%).
| Demographics | Rating | Rank | Nursery School |
| Panamanians | 34.3 /100 | #190 | Fair 97.9% |
| Immigrants | Taiwan | 30.6 /100 | #191 | Fair 97.9% |
| Blacks/African Americans | 29.4 /100 | #192 | Fair 97.9% |
| Paraguayans | 27.4 /100 | #193 | Fair 97.9% |
| Mongolians | 27.3 /100 | #194 | Fair 97.9% |
| Hawaiians | 27.2 /100 | #195 | Fair 97.9% |
| Guamanians/Chamorros | 25.7 /100 | #196 | Fair 97.9% |
| Yuman | 25.7 /100 | #197 | Fair 97.9% |
| Immigrants | Kenya | 24.1 /100 | #198 | Fair 97.9% |
| Immigrants | Egypt | 22.5 /100 | #199 | Fair 97.9% |
| Tohono O'odham | 22.2 /100 | #200 | Fair 97.9% |
| Immigrants | Lebanon | 21.2 /100 | #201 | Fair 97.9% |
| Immigrants | Ukraine | 19.9 /100 | #202 | Poor 97.9% |
| Immigrants | Uganda | 18.0 /100 | #203 | Poor 97.9% |
| Immigrants | Southern Europe | 17.4 /100 | #204 | Poor 97.9% |
Demographics Similar to West Indians by Nursery School
In terms of nursery school, the demographic groups most similar to West Indians are Immigrants from Nigeria (97.5%, a difference of 0.0%), Immigrants from Liberia (97.5%, a difference of 0.0%), Immigrants from Sierra Leone (97.6%, a difference of 0.010%), Immigrants from Jamaica (97.5%, a difference of 0.010%), and Fijian (97.6%, a difference of 0.020%).
| Demographics | Rating | Rank | Nursery School |
| Cubans | 0.4 /100 | #261 | Tragic 97.6% |
| Immigrants | Ethiopia | 0.4 /100 | #262 | Tragic 97.6% |
| Fijians | 0.3 /100 | #263 | Tragic 97.6% |
| Taiwanese | 0.3 /100 | #264 | Tragic 97.6% |
| Assyrians/Chaldeans/Syriacs | 0.3 /100 | #265 | Tragic 97.6% |
| Immigrants | Sierra Leone | 0.3 /100 | #266 | Tragic 97.6% |
| Immigrants | Nigeria | 0.3 /100 | #267 | Tragic 97.5% |
| West Indians | 0.3 /100 | #268 | Tragic 97.5% |
| Immigrants | Liberia | 0.3 /100 | #269 | Tragic 97.5% |
| Immigrants | Jamaica | 0.2 /100 | #270 | Tragic 97.5% |
| Immigrants | Peru | 0.2 /100 | #271 | Tragic 97.5% |
| Immigrants | Bolivia | 0.1 /100 | #272 | Tragic 97.5% |
| Immigrants | China | 0.1 /100 | #273 | Tragic 97.5% |
| Immigrants | Cameroon | 0.1 /100 | #274 | Tragic 97.5% |
| Ghanaians | 0.1 /100 | #275 | Tragic 97.5% |