Immigrants from Sudan vs West Indian Ambulatory Disability
COMPARE
Immigrants from Sudan
West Indian
Ambulatory Disability
Ambulatory Disability Comparison
Immigrants from Sudan
West Indians
5.8%
AMBULATORY DISABILITY
98.8/ 100
METRIC RATING
91st/ 347
METRIC RANK
6.9%
AMBULATORY DISABILITY
0.0/ 100
METRIC RATING
291st/ 347
METRIC RANK
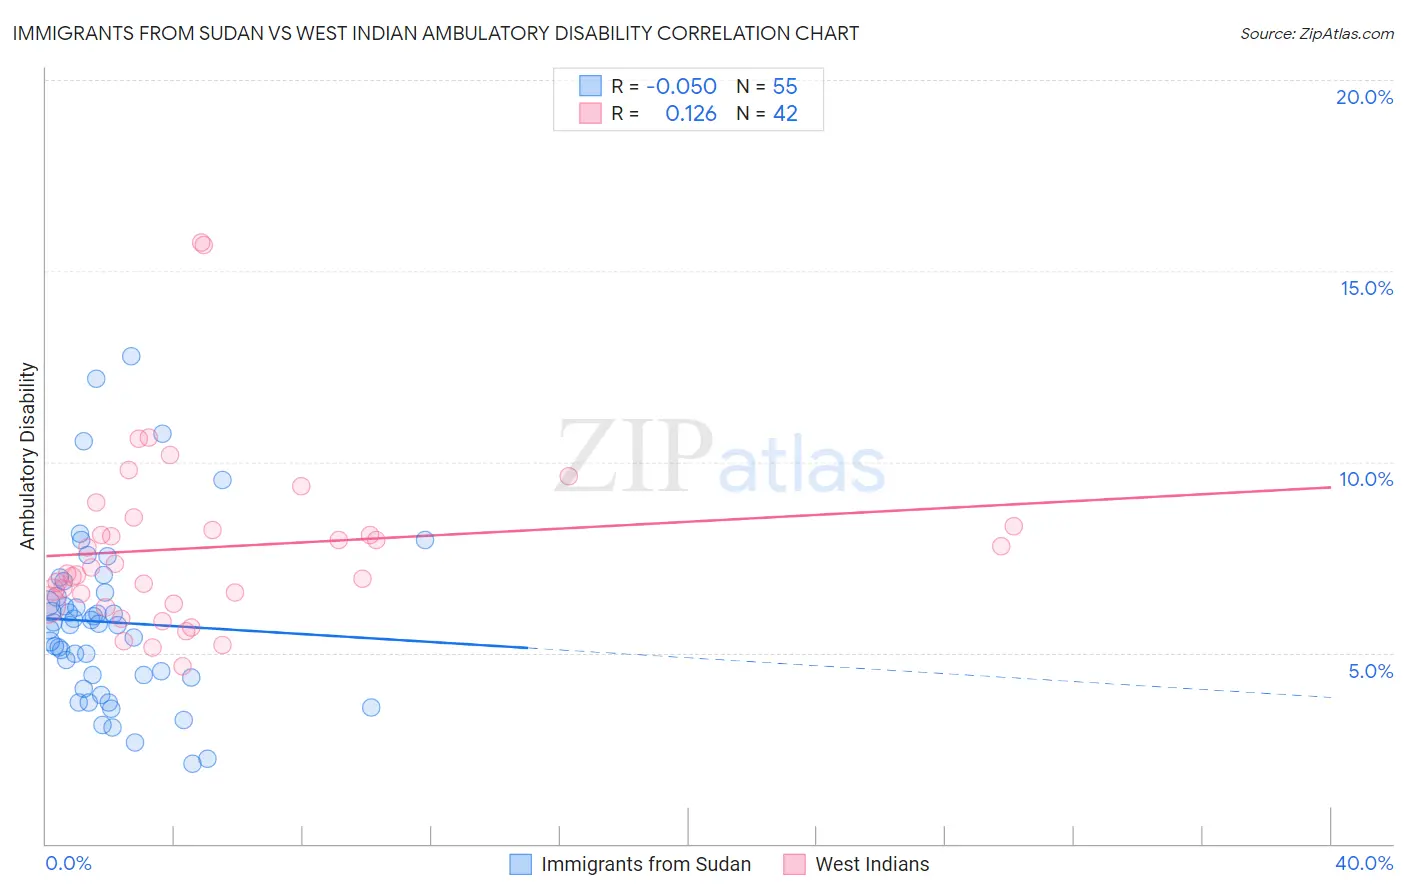
Immigrants from Sudan vs West Indian Ambulatory Disability Correlation Chart
The statistical analysis conducted on geographies consisting of 118,955,409 people shows a slight negative correlation between the proportion of Immigrants from Sudan and percentage of population with ambulatory disability in the United States with a correlation coefficient (R) of -0.050 and weighted average of 5.8%. Similarly, the statistical analysis conducted on geographies consisting of 253,984,061 people shows a poor positive correlation between the proportion of West Indians and percentage of population with ambulatory disability in the United States with a correlation coefficient (R) of 0.126 and weighted average of 6.9%, a difference of 19.3%.
Ambulatory Disability Correlation Summary
| Measurement | Immigrants from Sudan | West Indian |
| Minimum | 2.1% | 4.7% |
| Maximum | 12.8% | 15.7% |
| Range | 10.7% | 11.1% |
| Mean | 5.8% | 7.8% |
| Median | 5.7% | 7.2% |
| Interquartile 25% (IQ1) | 4.3% | 6.3% |
| Interquartile 75% (IQ3) | 6.6% | 8.3% |
| Interquartile Range (IQR) | 2.2% | 2.0% |
| Standard Deviation (Sample) | 2.3% | 2.3% |
| Standard Deviation (Population) | 2.2% | 2.3% |
Similar Demographics by Ambulatory Disability
Demographics Similar to Immigrants from Sudan by Ambulatory Disability
In terms of ambulatory disability, the demographic groups most similar to Immigrants from Sudan are Bhutanese (5.8%, a difference of 0.0%), Australian (5.8%, a difference of 0.0%), Soviet Union (5.8%, a difference of 0.12%), Immigrants from Chile (5.8%, a difference of 0.17%), and Immigrants from Sierra Leone (5.8%, a difference of 0.17%).
| Demographics | Rating | Rank | Ambulatory Disability |
| Ugandans | 99.2 /100 | #84 | Exceptional 5.7% |
| South Americans | 99.0 /100 | #85 | Exceptional 5.7% |
| Latvians | 99.0 /100 | #86 | Exceptional 5.7% |
| Immigrants | Chile | 98.9 /100 | #87 | Exceptional 5.8% |
| Soviet Union | 98.9 /100 | #88 | Exceptional 5.8% |
| Bhutanese | 98.8 /100 | #89 | Exceptional 5.8% |
| Australians | 98.8 /100 | #90 | Exceptional 5.8% |
| Immigrants | Sudan | 98.8 /100 | #91 | Exceptional 5.8% |
| Immigrants | Sierra Leone | 98.6 /100 | #92 | Exceptional 5.8% |
| Immigrants | Denmark | 98.6 /100 | #93 | Exceptional 5.8% |
| Kenyans | 98.4 /100 | #94 | Exceptional 5.8% |
| Immigrants | El Salvador | 98.4 /100 | #95 | Exceptional 5.8% |
| Salvadorans | 98.4 /100 | #96 | Exceptional 5.8% |
| Immigrants | Somalia | 98.3 /100 | #97 | Exceptional 5.8% |
| Immigrants | Lebanon | 98.3 /100 | #98 | Exceptional 5.8% |
Demographics Similar to West Indians by Ambulatory Disability
In terms of ambulatory disability, the demographic groups most similar to West Indians are Cheyenne (6.9%, a difference of 0.060%), Scotch-Irish (6.9%, a difference of 0.10%), Immigrants from Dominica (6.9%, a difference of 0.12%), Nonimmigrants (6.9%, a difference of 0.27%), and Immigrants from St. Vincent and the Grenadines (6.9%, a difference of 0.30%).
| Demographics | Rating | Rank | Ambulatory Disability |
| Immigrants | Jamaica | 0.0 /100 | #284 | Tragic 6.8% |
| Fijians | 0.0 /100 | #285 | Tragic 6.8% |
| Yakama | 0.0 /100 | #286 | Tragic 6.8% |
| U.S. Virgin Islanders | 0.0 /100 | #287 | Tragic 6.8% |
| Immigrants | Nonimmigrants | 0.0 /100 | #288 | Tragic 6.9% |
| Immigrants | Dominica | 0.0 /100 | #289 | Tragic 6.9% |
| Scotch-Irish | 0.0 /100 | #290 | Tragic 6.9% |
| West Indians | 0.0 /100 | #291 | Tragic 6.9% |
| Cheyenne | 0.0 /100 | #292 | Tragic 6.9% |
| Immigrants | St. Vincent and the Grenadines | 0.0 /100 | #293 | Tragic 6.9% |
| Cape Verdeans | 0.0 /100 | #294 | Tragic 6.9% |
| Crow | 0.0 /100 | #295 | Tragic 6.9% |
| Alaskan Athabascans | 0.0 /100 | #296 | Tragic 6.9% |
| French American Indians | 0.0 /100 | #297 | Tragic 6.9% |
| Immigrants | Grenada | 0.0 /100 | #298 | Tragic 6.9% |