White/Caucasian vs South American Indian Vision Disability
COMPARE
White/Caucasian
South American Indian
Vision Disability
Vision Disability Comparison
Whites/Caucasians
South American Indians
2.4%
VISION DISABILITY
0.2/ 100
METRIC RATING
259th/ 347
METRIC RANK
2.2%
VISION DISABILITY
57.4/ 100
METRIC RATING
169th/ 347
METRIC RANK
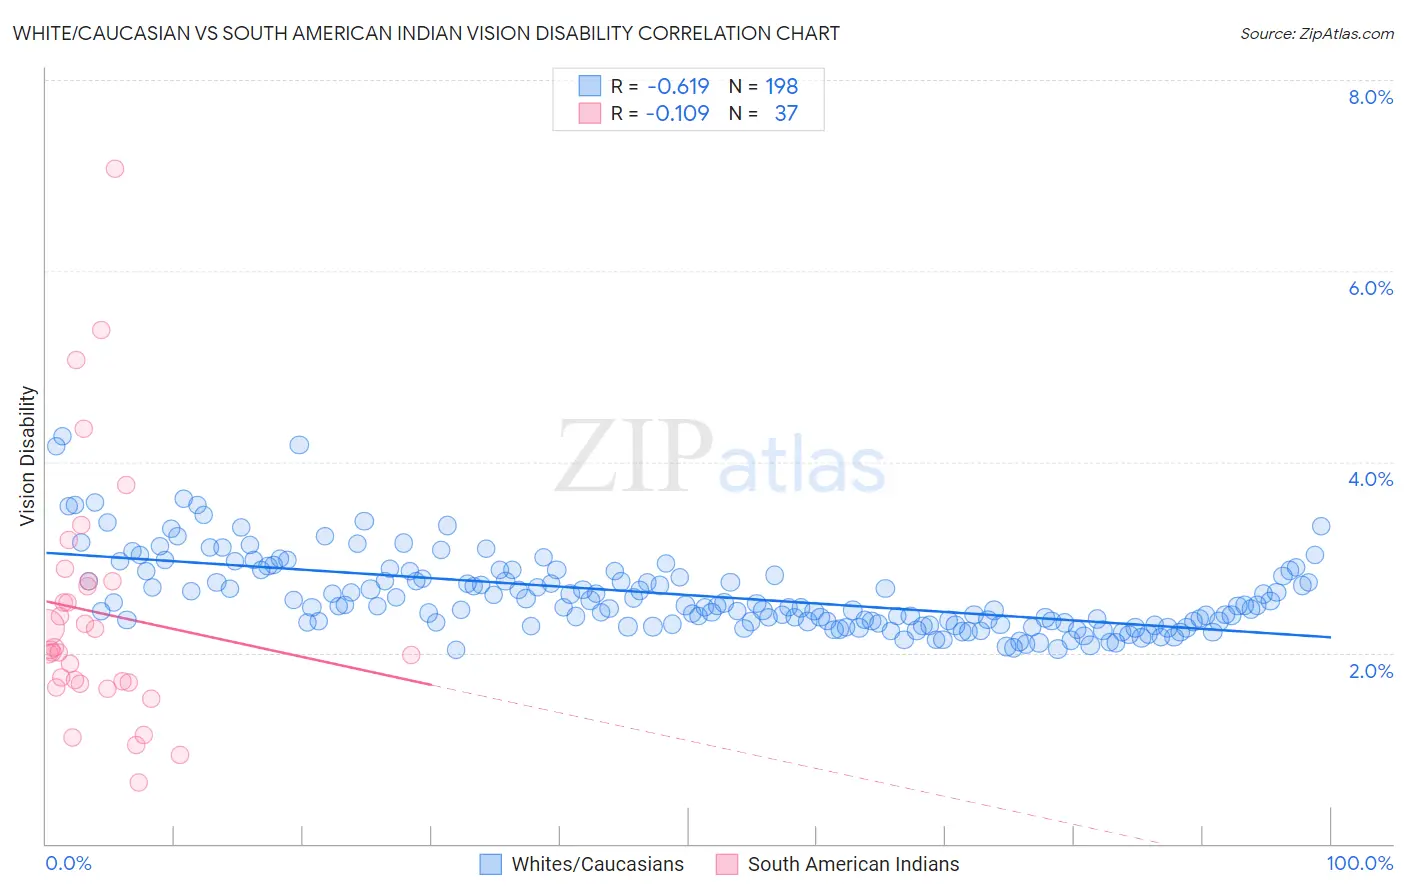
White/Caucasian vs South American Indian Vision Disability Correlation Chart
The statistical analysis conducted on geographies consisting of 580,529,348 people shows a significant negative correlation between the proportion of Whites/Caucasians and percentage of population with vision disability in the United States with a correlation coefficient (R) of -0.619 and weighted average of 2.4%. Similarly, the statistical analysis conducted on geographies consisting of 164,540,973 people shows a poor negative correlation between the proportion of South American Indians and percentage of population with vision disability in the United States with a correlation coefficient (R) of -0.109 and weighted average of 2.2%, a difference of 10.3%.
Vision Disability Correlation Summary
| Measurement | White/Caucasian | South American Indian |
| Minimum | 2.0% | 0.64% |
| Maximum | 4.3% | 7.1% |
| Range | 2.2% | 6.4% |
| Mean | 2.6% | 2.4% |
| Median | 2.5% | 2.0% |
| Interquartile 25% (IQ1) | 2.3% | 1.7% |
| Interquartile 75% (IQ3) | 2.8% | 2.8% |
| Interquartile Range (IQR) | 0.50% | 1.1% |
| Standard Deviation (Sample) | 0.41% | 1.3% |
| Standard Deviation (Population) | 0.41% | 1.3% |
Similar Demographics by Vision Disability
Demographics Similar to Whites/Caucasians by Vision Disability
In terms of vision disability, the demographic groups most similar to Whites/Caucasians are British West Indian (2.4%, a difference of 0.010%), West Indian (2.4%, a difference of 0.040%), Immigrants from Haiti (2.4%, a difference of 0.12%), Belizean (2.4%, a difference of 0.17%), and Fijian (2.4%, a difference of 0.38%).
| Demographics | Rating | Rank | Vision Disability |
| Immigrants | Micronesia | 0.3 /100 | #252 | Tragic 2.4% |
| Japanese | 0.3 /100 | #253 | Tragic 2.4% |
| Haitians | 0.3 /100 | #254 | Tragic 2.4% |
| Immigrants | Guatemala | 0.3 /100 | #255 | Tragic 2.4% |
| Immigrants | Haiti | 0.2 /100 | #256 | Tragic 2.4% |
| West Indians | 0.2 /100 | #257 | Tragic 2.4% |
| British West Indians | 0.2 /100 | #258 | Tragic 2.4% |
| Whites/Caucasians | 0.2 /100 | #259 | Tragic 2.4% |
| Belizeans | 0.2 /100 | #260 | Tragic 2.4% |
| Fijians | 0.1 /100 | #261 | Tragic 2.4% |
| Jamaicans | 0.1 /100 | #262 | Tragic 2.4% |
| Immigrants | Belize | 0.1 /100 | #263 | Tragic 2.4% |
| Immigrants | Liberia | 0.1 /100 | #264 | Tragic 2.4% |
| Immigrants | Jamaica | 0.1 /100 | #265 | Tragic 2.4% |
| Mexican American Indians | 0.1 /100 | #266 | Tragic 2.4% |
Demographics Similar to South American Indians by Vision Disability
In terms of vision disability, the demographic groups most similar to South American Indians are Swiss (2.2%, a difference of 0.11%), Lebanese (2.2%, a difference of 0.20%), Brazilian (2.1%, a difference of 0.32%), Immigrants from Africa (2.1%, a difference of 0.34%), and Immigrants from England (2.1%, a difference of 0.36%).
| Demographics | Rating | Rank | Vision Disability |
| Hungarians | 67.4 /100 | #162 | Good 2.1% |
| Icelanders | 66.1 /100 | #163 | Good 2.1% |
| Immigrants | Bangladesh | 65.5 /100 | #164 | Good 2.1% |
| Immigrants | Iraq | 64.8 /100 | #165 | Good 2.1% |
| Immigrants | England | 62.8 /100 | #166 | Good 2.1% |
| Immigrants | Africa | 62.6 /100 | #167 | Good 2.1% |
| Brazilians | 62.2 /100 | #168 | Good 2.1% |
| South American Indians | 57.4 /100 | #169 | Average 2.2% |
| Swiss | 55.7 /100 | #170 | Average 2.2% |
| Lebanese | 54.3 /100 | #171 | Average 2.2% |
| Northern Europeans | 50.1 /100 | #172 | Average 2.2% |
| Scandinavians | 50.0 /100 | #173 | Average 2.2% |
| Immigrants | Canada | 50.0 /100 | #174 | Average 2.2% |
| Immigrants | Fiji | 47.6 /100 | #175 | Average 2.2% |
| Yugoslavians | 46.5 /100 | #176 | Average 2.2% |