Yugoslavian vs Guyanese In Labor Force | Age 25-29
COMPARE
Yugoslavian
Guyanese
In Labor Force | Age 25-29
In Labor Force | Age 25-29 Comparison
Yugoslavians
Guyanese
85.6%
IN LABOR FORCE | AGE 25-29
99.8/ 100
METRIC RATING
50th/ 347
METRIC RANK
83.0%
IN LABOR FORCE | AGE 25-29
0.0/ 100
METRIC RATING
287th/ 347
METRIC RANK
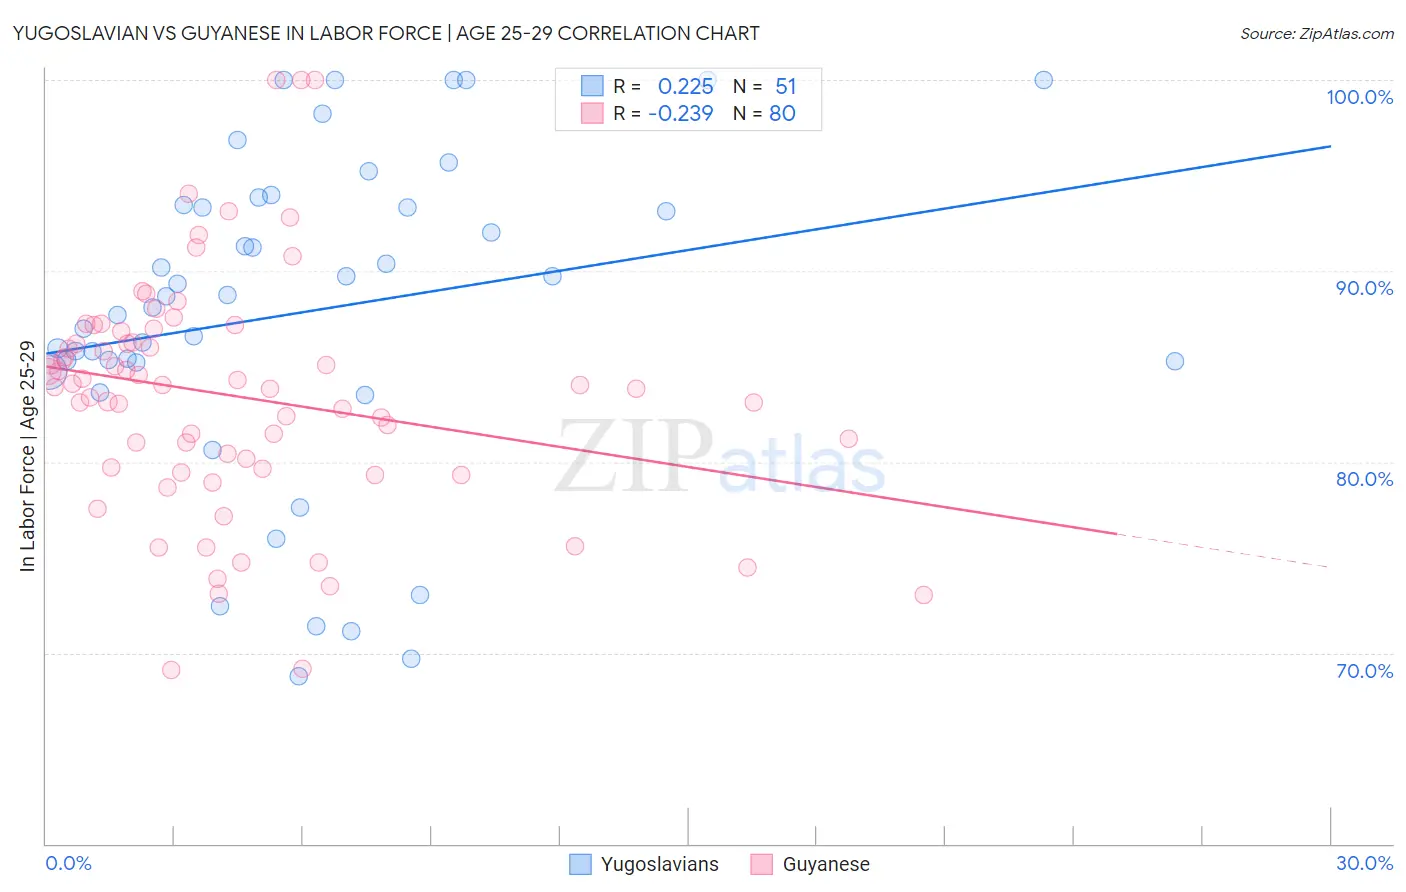
Yugoslavian vs Guyanese In Labor Force | Age 25-29 Correlation Chart
The statistical analysis conducted on geographies consisting of 285,642,405 people shows a weak positive correlation between the proportion of Yugoslavians and labor force participation rate among population between the ages 25 and 29 in the United States with a correlation coefficient (R) of 0.225 and weighted average of 85.6%. Similarly, the statistical analysis conducted on geographies consisting of 176,912,088 people shows a weak negative correlation between the proportion of Guyanese and labor force participation rate among population between the ages 25 and 29 in the United States with a correlation coefficient (R) of -0.239 and weighted average of 83.0%, a difference of 3.1%.
In Labor Force | Age 25-29 Correlation Summary
| Measurement | Yugoslavian | Guyanese |
| Minimum | 68.8% | 69.1% |
| Maximum | 100.0% | 100.0% |
| Range | 31.2% | 30.9% |
| Mean | 87.9% | 83.4% |
| Median | 88.7% | 84.0% |
| Interquartile 25% (IQ1) | 85.2% | 79.7% |
| Interquartile 75% (IQ3) | 93.5% | 86.5% |
| Interquartile Range (IQR) | 8.3% | 6.8% |
| Standard Deviation (Sample) | 8.4% | 6.2% |
| Standard Deviation (Population) | 8.3% | 6.2% |
Similar Demographics by In Labor Force | Age 25-29
Demographics Similar to Yugoslavians by In Labor Force | Age 25-29
In terms of in labor force | age 25-29, the demographic groups most similar to Yugoslavians are Immigrants from Latvia (85.6%, a difference of 0.0%), Swedish (85.6%, a difference of 0.030%), Immigrants from Poland (85.6%, a difference of 0.030%), Turkish (85.6%, a difference of 0.040%), and Italian (85.6%, a difference of 0.040%).
| Demographics | Rating | Rank | In Labor Force | Age 25-29 |
| Immigrants | India | 99.9 /100 | #43 | Exceptional 85.7% |
| Macedonians | 99.9 /100 | #44 | Exceptional 85.7% |
| Immigrants | Sierra Leone | 99.9 /100 | #45 | Exceptional 85.7% |
| Czechs | 99.8 /100 | #46 | Exceptional 85.6% |
| Turks | 99.8 /100 | #47 | Exceptional 85.6% |
| Italians | 99.8 /100 | #48 | Exceptional 85.6% |
| Swedes | 99.8 /100 | #49 | Exceptional 85.6% |
| Yugoslavians | 99.8 /100 | #50 | Exceptional 85.6% |
| Immigrants | Latvia | 99.8 /100 | #51 | Exceptional 85.6% |
| Immigrants | Poland | 99.7 /100 | #52 | Exceptional 85.6% |
| Belgians | 99.7 /100 | #53 | Exceptional 85.5% |
| Albanians | 99.7 /100 | #54 | Exceptional 85.5% |
| Immigrants | Brazil | 99.7 /100 | #55 | Exceptional 85.5% |
| Eastern Europeans | 99.6 /100 | #56 | Exceptional 85.5% |
| Estonians | 99.6 /100 | #57 | Exceptional 85.5% |
Demographics Similar to Guyanese by In Labor Force | Age 25-29
In terms of in labor force | age 25-29, the demographic groups most similar to Guyanese are Mexican American Indian (83.0%, a difference of 0.020%), Belizean (83.1%, a difference of 0.030%), Ottawa (83.0%, a difference of 0.030%), Immigrants from Micronesia (83.0%, a difference of 0.050%), and Nicaraguan (83.1%, a difference of 0.070%).
| Demographics | Rating | Rank | In Labor Force | Age 25-29 |
| Dominicans | 0.0 /100 | #280 | Tragic 83.2% |
| Immigrants | Dominican Republic | 0.0 /100 | #281 | Tragic 83.1% |
| Americans | 0.0 /100 | #282 | Tragic 83.1% |
| Immigrants | Azores | 0.0 /100 | #283 | Tragic 83.1% |
| Nicaraguans | 0.0 /100 | #284 | Tragic 83.1% |
| Belizeans | 0.0 /100 | #285 | Tragic 83.1% |
| Mexican American Indians | 0.0 /100 | #286 | Tragic 83.0% |
| Guyanese | 0.0 /100 | #287 | Tragic 83.0% |
| Ottawa | 0.0 /100 | #288 | Tragic 83.0% |
| Immigrants | Micronesia | 0.0 /100 | #289 | Tragic 83.0% |
| Immigrants | Bangladesh | 0.0 /100 | #290 | Tragic 83.0% |
| Hawaiians | 0.0 /100 | #291 | Tragic 83.0% |
| Immigrants | Guyana | 0.0 /100 | #292 | Tragic 83.0% |
| Immigrants | Latin America | 0.0 /100 | #293 | Tragic 82.9% |
| Nepalese | 0.0 /100 | #294 | Tragic 82.9% |