Filipino vs Chippewa Hearing Disability
COMPARE
Filipino
Chippewa
Hearing Disability
Hearing Disability Comparison
Filipinos
Chippewa
2.6%
HEARING DISABILITY
99.6/ 100
METRIC RATING
33rd/ 347
METRIC RANK
4.0%
HEARING DISABILITY
0.0/ 100
METRIC RATING
319th/ 347
METRIC RANK
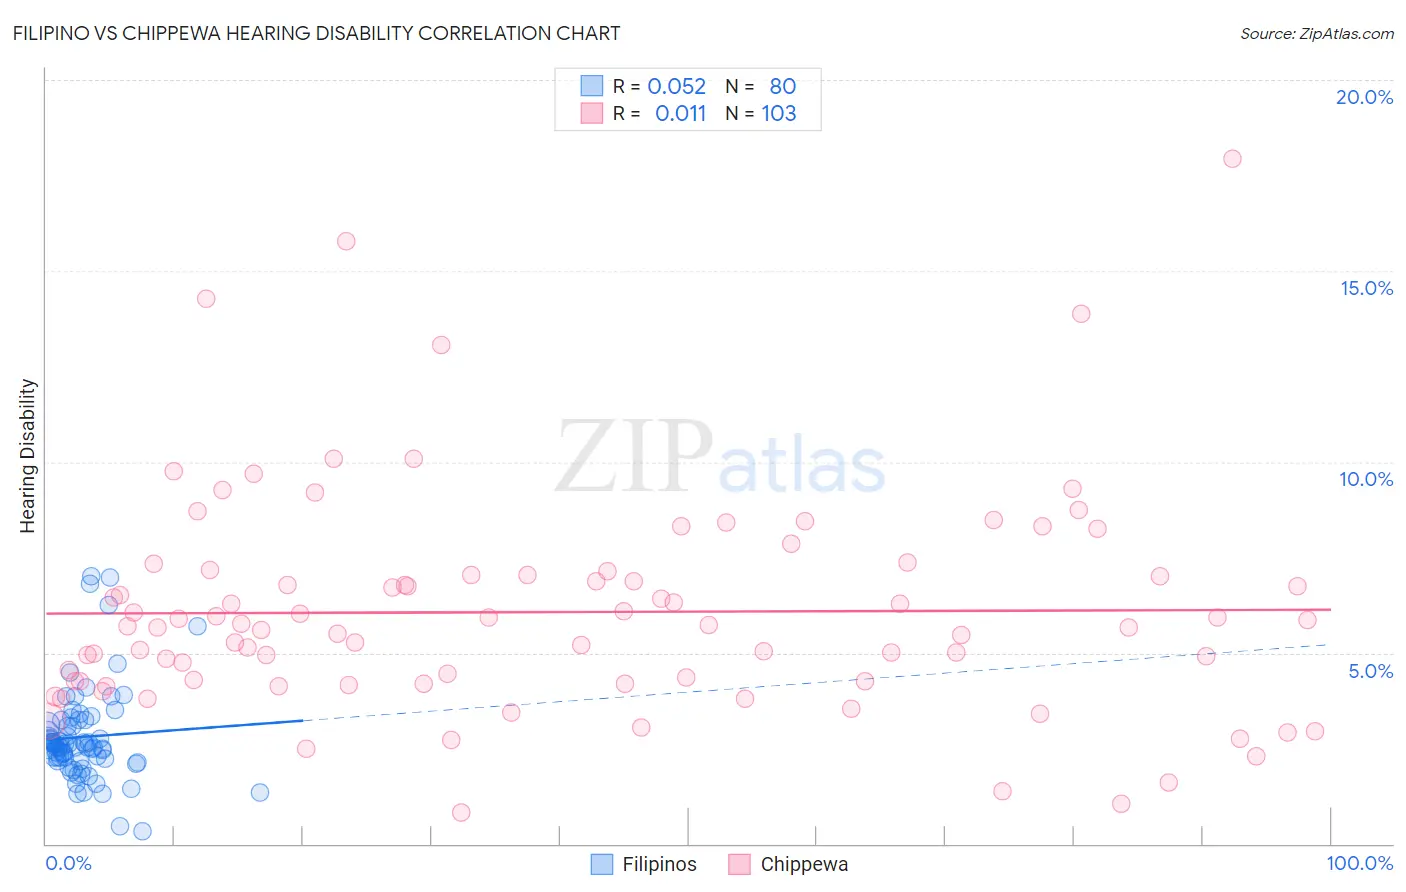
Filipino vs Chippewa Hearing Disability Correlation Chart
The statistical analysis conducted on geographies consisting of 254,308,398 people shows a slight positive correlation between the proportion of Filipinos and percentage of population with hearing disability in the United States with a correlation coefficient (R) of 0.052 and weighted average of 2.6%. Similarly, the statistical analysis conducted on geographies consisting of 215,037,759 people shows no correlation between the proportion of Chippewa and percentage of population with hearing disability in the United States with a correlation coefficient (R) of 0.011 and weighted average of 4.0%, a difference of 53.3%.
Hearing Disability Correlation Summary
| Measurement | Filipino | Chippewa |
| Minimum | 0.31% | 0.81% |
| Maximum | 7.0% | 17.9% |
| Range | 6.7% | 17.1% |
| Mean | 2.8% | 6.1% |
| Median | 2.6% | 5.7% |
| Interquartile 25% (IQ1) | 2.2% | 4.2% |
| Interquartile 75% (IQ3) | 3.2% | 7.0% |
| Interquartile Range (IQR) | 0.96% | 2.8% |
| Standard Deviation (Sample) | 1.3% | 2.9% |
| Standard Deviation (Population) | 1.2% | 2.9% |
Similar Demographics by Hearing Disability
Demographics Similar to Filipinos by Hearing Disability
In terms of hearing disability, the demographic groups most similar to Filipinos are Immigrants from Pakistan (2.6%, a difference of 0.040%), Salvadoran (2.6%, a difference of 0.16%), Immigrants from Venezuela (2.6%, a difference of 0.26%), Okinawan (2.6%, a difference of 0.39%), and Immigrants from Cameroon (2.6%, a difference of 0.40%).
| Demographics | Rating | Rank | Hearing Disability |
| Immigrants | Senegal | 99.7 /100 | #26 | Exceptional 2.6% |
| Immigrants | South Central Asia | 99.7 /100 | #27 | Exceptional 2.6% |
| Immigrants | Haiti | 99.7 /100 | #28 | Exceptional 2.6% |
| Bolivians | 99.7 /100 | #29 | Exceptional 2.6% |
| Immigrants | Caribbean | 99.7 /100 | #30 | Exceptional 2.6% |
| Immigrants | Cameroon | 99.7 /100 | #31 | Exceptional 2.6% |
| Immigrants | Venezuela | 99.7 /100 | #32 | Exceptional 2.6% |
| Filipinos | 99.6 /100 | #33 | Exceptional 2.6% |
| Immigrants | Pakistan | 99.6 /100 | #34 | Exceptional 2.6% |
| Salvadorans | 99.6 /100 | #35 | Exceptional 2.6% |
| Okinawans | 99.6 /100 | #36 | Exceptional 2.6% |
| Immigrants | Western Africa | 99.6 /100 | #37 | Exceptional 2.6% |
| Immigrants | Jamaica | 99.5 /100 | #38 | Exceptional 2.6% |
| Immigrants | China | 99.5 /100 | #39 | Exceptional 2.6% |
| Haitians | 99.5 /100 | #40 | Exceptional 2.6% |
Demographics Similar to Chippewa by Hearing Disability
In terms of hearing disability, the demographic groups most similar to Chippewa are Cheyenne (4.0%, a difference of 0.65%), Shoshone (4.0%, a difference of 0.81%), Comanche (4.0%, a difference of 0.82%), Spanish American (4.0%, a difference of 0.95%), and Puget Sound Salish (3.9%, a difference of 1.1%).
| Demographics | Rating | Rank | Hearing Disability |
| Cajuns | 0.0 /100 | #312 | Tragic 3.9% |
| Hopi | 0.0 /100 | #313 | Tragic 3.9% |
| Yakama | 0.0 /100 | #314 | Tragic 3.9% |
| Puget Sound Salish | 0.0 /100 | #315 | Tragic 3.9% |
| Spanish Americans | 0.0 /100 | #316 | Tragic 4.0% |
| Comanche | 0.0 /100 | #317 | Tragic 4.0% |
| Cheyenne | 0.0 /100 | #318 | Tragic 4.0% |
| Chippewa | 0.0 /100 | #319 | Tragic 4.0% |
| Shoshone | 0.0 /100 | #320 | Tragic 4.0% |
| Paiute | 0.0 /100 | #321 | Tragic 4.1% |
| Seminole | 0.0 /100 | #322 | Tragic 4.1% |
| Apache | 0.0 /100 | #323 | Tragic 4.1% |
| Osage | 0.0 /100 | #324 | Tragic 4.1% |
| Lumbee | 0.0 /100 | #325 | Tragic 4.1% |
| Potawatomi | 0.0 /100 | #326 | Tragic 4.1% |