Salvadoran vs Immigrants from Hungary Female Disability
COMPARE
Salvadoran
Immigrants from Hungary
Female Disability
Female Disability Comparison
Salvadorans
Immigrants from Hungary
11.5%
FEMALE DISABILITY
99.8/ 100
METRIC RATING
66th/ 347
METRIC RANK
11.9%
FEMALE DISABILITY
92.8/ 100
METRIC RATING
139th/ 347
METRIC RANK
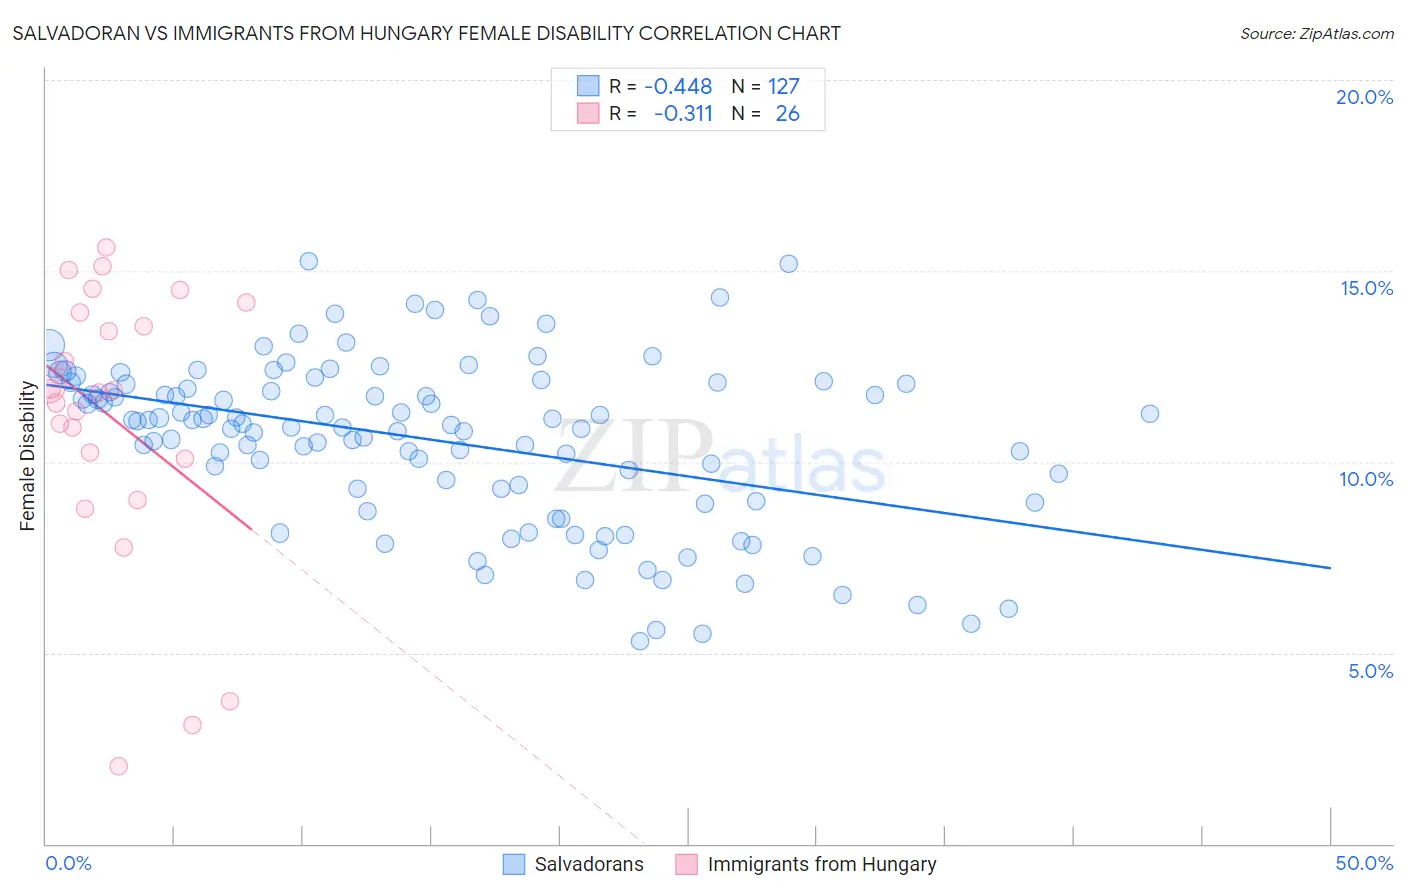
Salvadoran vs Immigrants from Hungary Female Disability Correlation Chart
The statistical analysis conducted on geographies consisting of 398,928,715 people shows a moderate negative correlation between the proportion of Salvadorans and percentage of females with a disability in the United States with a correlation coefficient (R) of -0.448 and weighted average of 11.5%. Similarly, the statistical analysis conducted on geographies consisting of 195,708,116 people shows a mild negative correlation between the proportion of Immigrants from Hungary and percentage of females with a disability in the United States with a correlation coefficient (R) of -0.311 and weighted average of 11.9%, a difference of 3.8%.
Female Disability Correlation Summary
| Measurement | Salvadoran | Immigrants from Hungary |
| Minimum | 5.3% | 2.0% |
| Maximum | 15.3% | 15.6% |
| Range | 9.9% | 13.6% |
| Mean | 10.6% | 11.1% |
| Median | 11.0% | 11.8% |
| Interquartile 25% (IQ1) | 9.3% | 10.1% |
| Interquartile 75% (IQ3) | 12.0% | 13.9% |
| Interquartile Range (IQR) | 2.8% | 3.8% |
| Standard Deviation (Sample) | 2.2% | 3.6% |
| Standard Deviation (Population) | 2.2% | 3.6% |
Similar Demographics by Female Disability
Demographics Similar to Salvadorans by Female Disability
In terms of female disability, the demographic groups most similar to Salvadorans are Immigrants from Vietnam (11.5%, a difference of 0.050%), Immigrants from Northern Africa (11.5%, a difference of 0.060%), Colombian (11.5%, a difference of 0.14%), Immigrants from Chile (11.5%, a difference of 0.15%), and Immigrants from South America (11.4%, a difference of 0.17%).
| Demographics | Rating | Rank | Female Disability |
| Immigrants | Spain | 99.9 /100 | #59 | Exceptional 11.4% |
| Immigrants | Bulgaria | 99.9 /100 | #60 | Exceptional 11.4% |
| Immigrants | France | 99.9 /100 | #61 | Exceptional 11.4% |
| Sri Lankans | 99.9 /100 | #62 | Exceptional 11.4% |
| Immigrants | Colombia | 99.9 /100 | #63 | Exceptional 11.4% |
| Immigrants | El Salvador | 99.9 /100 | #64 | Exceptional 11.4% |
| Immigrants | South America | 99.9 /100 | #65 | Exceptional 11.4% |
| Salvadorans | 99.8 /100 | #66 | Exceptional 11.5% |
| Immigrants | Vietnam | 99.8 /100 | #67 | Exceptional 11.5% |
| Immigrants | Northern Africa | 99.8 /100 | #68 | Exceptional 11.5% |
| Colombians | 99.8 /100 | #69 | Exceptional 11.5% |
| Immigrants | Chile | 99.8 /100 | #70 | Exceptional 11.5% |
| Immigrants | Ireland | 99.8 /100 | #71 | Exceptional 11.5% |
| Chileans | 99.8 /100 | #72 | Exceptional 11.5% |
| Immigrants | Switzerland | 99.8 /100 | #73 | Exceptional 11.5% |
Demographics Similar to Immigrants from Hungary by Female Disability
In terms of female disability, the demographic groups most similar to Immigrants from Hungary are Ecuadorian (11.9%, a difference of 0.090%), Immigrants from Norway (11.9%, a difference of 0.15%), Romanian (11.9%, a difference of 0.16%), Immigrants from Ecuador (11.9%, a difference of 0.18%), and Ugandan (11.9%, a difference of 0.19%).
| Demographics | Rating | Rank | Female Disability |
| Immigrants | Syria | 94.6 /100 | #132 | Exceptional 11.9% |
| Kenyans | 94.5 /100 | #133 | Exceptional 11.9% |
| Immigrants | Nicaragua | 94.5 /100 | #134 | Exceptional 11.9% |
| Central Americans | 94.2 /100 | #135 | Exceptional 11.9% |
| Ugandans | 94.0 /100 | #136 | Exceptional 11.9% |
| Immigrants | Norway | 93.8 /100 | #137 | Exceptional 11.9% |
| Ecuadorians | 93.4 /100 | #138 | Exceptional 11.9% |
| Immigrants | Hungary | 92.8 /100 | #139 | Exceptional 11.9% |
| Romanians | 91.6 /100 | #140 | Exceptional 11.9% |
| Immigrants | Ecuador | 91.5 /100 | #141 | Exceptional 11.9% |
| Immigrants | Africa | 90.0 /100 | #142 | Excellent 11.9% |
| Immigrants | Sudan | 89.6 /100 | #143 | Excellent 11.9% |
| Immigrants | Austria | 87.9 /100 | #144 | Excellent 12.0% |
| Estonians | 87.8 /100 | #145 | Excellent 12.0% |
| Pakistanis | 84.6 /100 | #146 | Excellent 12.0% |