Immigrants from Croatia vs Immigrants from Hungary Female Disability
COMPARE
Immigrants from Croatia
Immigrants from Hungary
Female Disability
Female Disability Comparison
Immigrants from Croatia
Immigrants from Hungary
11.8%
FEMALE DISABILITY
96.7/ 100
METRIC RATING
123rd/ 347
METRIC RANK
11.9%
FEMALE DISABILITY
92.8/ 100
METRIC RATING
139th/ 347
METRIC RANK
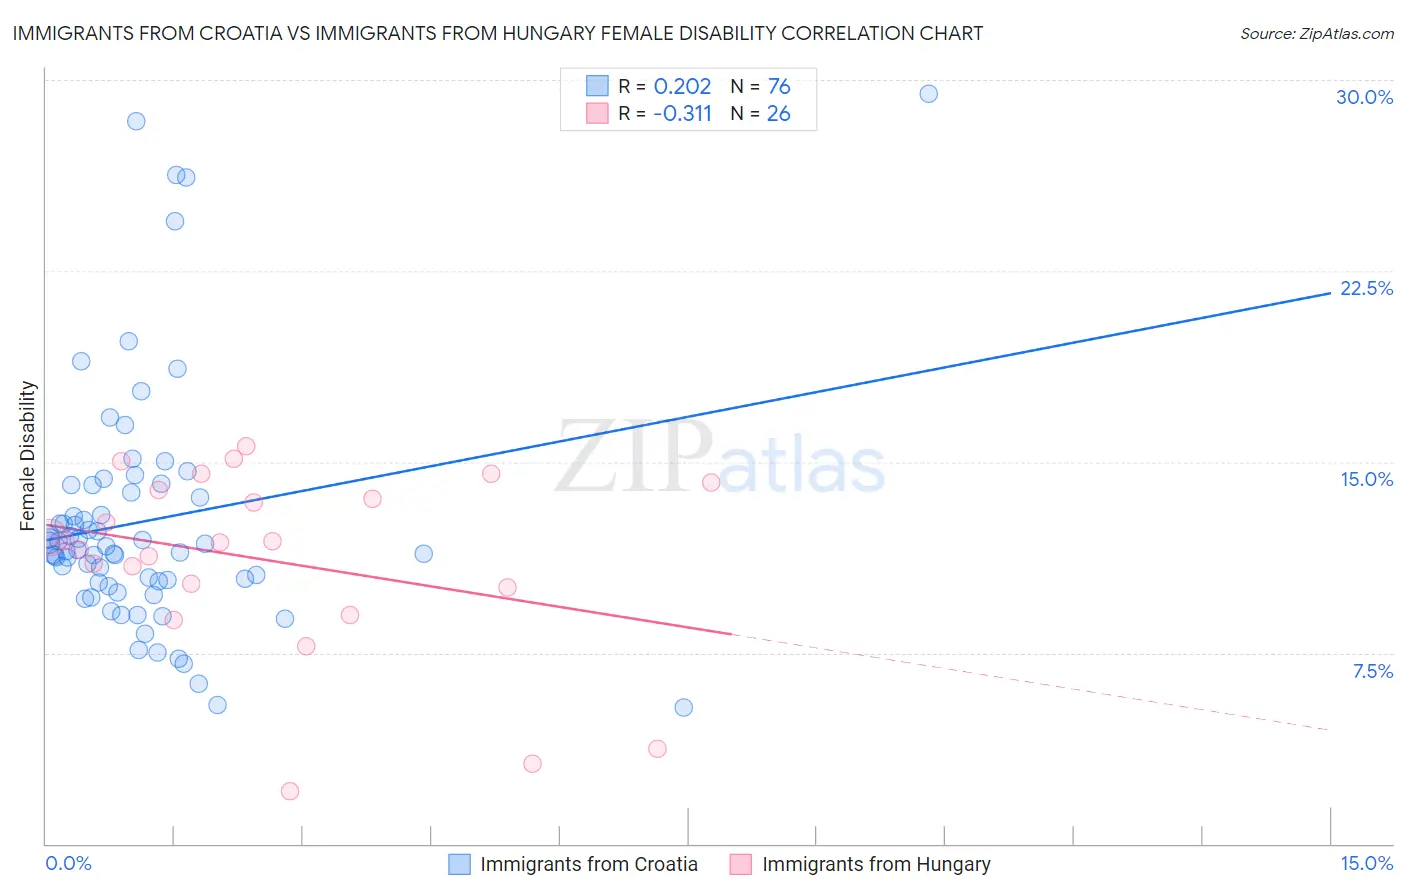
Immigrants from Croatia vs Immigrants from Hungary Female Disability Correlation Chart
The statistical analysis conducted on geographies consisting of 132,577,036 people shows a weak positive correlation between the proportion of Immigrants from Croatia and percentage of females with a disability in the United States with a correlation coefficient (R) of 0.202 and weighted average of 11.8%. Similarly, the statistical analysis conducted on geographies consisting of 195,708,116 people shows a mild negative correlation between the proportion of Immigrants from Hungary and percentage of females with a disability in the United States with a correlation coefficient (R) of -0.311 and weighted average of 11.9%, a difference of 0.79%.
Female Disability Correlation Summary
| Measurement | Immigrants from Croatia | Immigrants from Hungary |
| Minimum | 5.3% | 2.0% |
| Maximum | 29.4% | 15.6% |
| Range | 24.1% | 13.6% |
| Mean | 12.7% | 11.1% |
| Median | 11.6% | 11.8% |
| Interquartile 25% (IQ1) | 10.3% | 10.1% |
| Interquartile 75% (IQ3) | 13.9% | 13.9% |
| Interquartile Range (IQR) | 3.6% | 3.8% |
| Standard Deviation (Sample) | 4.8% | 3.6% |
| Standard Deviation (Population) | 4.7% | 3.6% |
Demographics Similar to Immigrants from Croatia and Immigrants from Hungary by Female Disability
In terms of female disability, the demographic groups most similar to Immigrants from Croatia are Immigrants from North Macedonia (11.8%, a difference of 0.050%), Russian (11.8%, a difference of 0.050%), Immigrants from Netherlands (11.8%, a difference of 0.060%), Immigrants from Italy (11.8%, a difference of 0.070%), and Immigrants from Europe (11.8%, a difference of 0.14%). Similarly, the demographic groups most similar to Immigrants from Hungary are Ecuadorian (11.9%, a difference of 0.090%), Immigrants from Norway (11.9%, a difference of 0.15%), Romanian (11.9%, a difference of 0.16%), Immigrants from Ecuador (11.9%, a difference of 0.18%), and Ugandan (11.9%, a difference of 0.19%).
| Demographics | Rating | Rank | Female Disability |
| Immigrants | Netherlands | 96.9 /100 | #121 | Exceptional 11.8% |
| Immigrants | North Macedonia | 96.8 /100 | #122 | Exceptional 11.8% |
| Immigrants | Croatia | 96.7 /100 | #123 | Exceptional 11.8% |
| Russians | 96.5 /100 | #124 | Exceptional 11.8% |
| Immigrants | Italy | 96.4 /100 | #125 | Exceptional 11.8% |
| Immigrants | Europe | 96.2 /100 | #126 | Exceptional 11.8% |
| South American Indians | 95.8 /100 | #127 | Exceptional 11.8% |
| Immigrants | Latvia | 95.6 /100 | #128 | Exceptional 11.8% |
| Macedonians | 95.5 /100 | #129 | Exceptional 11.8% |
| Nicaraguans | 95.2 /100 | #130 | Exceptional 11.9% |
| Arabs | 95.1 /100 | #131 | Exceptional 11.9% |
| Immigrants | Syria | 94.6 /100 | #132 | Exceptional 11.9% |
| Kenyans | 94.5 /100 | #133 | Exceptional 11.9% |
| Immigrants | Nicaragua | 94.5 /100 | #134 | Exceptional 11.9% |
| Central Americans | 94.2 /100 | #135 | Exceptional 11.9% |
| Ugandans | 94.0 /100 | #136 | Exceptional 11.9% |
| Immigrants | Norway | 93.8 /100 | #137 | Exceptional 11.9% |
| Ecuadorians | 93.4 /100 | #138 | Exceptional 11.9% |
| Immigrants | Hungary | 92.8 /100 | #139 | Exceptional 11.9% |
| Romanians | 91.6 /100 | #140 | Exceptional 11.9% |
| Immigrants | Ecuador | 91.5 /100 | #141 | Exceptional 11.9% |