Houma vs Navajo Disability Age Under 5
COMPARE
Houma
Navajo
Disability Age Under 5
Disability Age Under 5 Comparison
Houma
Navajo
1.9%
DISABILITY AGE UNDER 5
0.0/ 100
METRIC RATING
329th/ 347
METRIC RANK
1.6%
DISABILITY AGE UNDER 5
0.0/ 100
METRIC RATING
308th/ 347
METRIC RANK
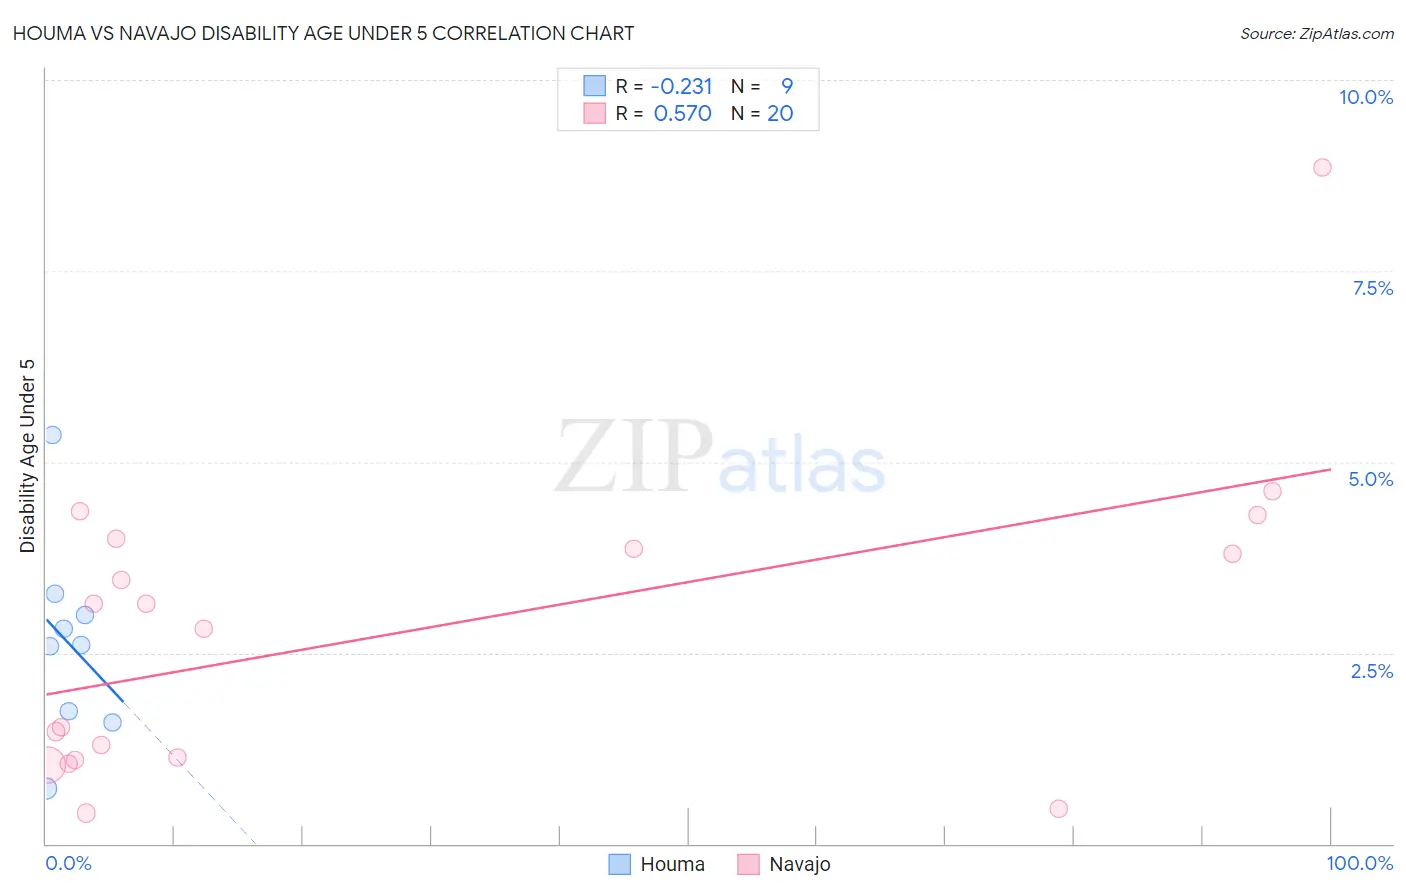
Houma vs Navajo Disability Age Under 5 Correlation Chart
The statistical analysis conducted on geographies consisting of 31,359,385 people shows a weak negative correlation between the proportion of Houma and percentage of population with a disability under the age of 5 in the United States with a correlation coefficient (R) of -0.231 and weighted average of 1.9%. Similarly, the statistical analysis conducted on geographies consisting of 151,471,391 people shows a substantial positive correlation between the proportion of Navajo and percentage of population with a disability under the age of 5 in the United States with a correlation coefficient (R) of 0.570 and weighted average of 1.6%, a difference of 13.2%.
Disability Age Under 5 Correlation Summary
| Measurement | Houma | Navajo |
| Minimum | 0.72% | 0.40% |
| Maximum | 5.4% | 8.9% |
| Range | 4.6% | 8.5% |
| Mean | 2.6% | 2.8% |
| Median | 2.6% | 3.0% |
| Interquartile 25% (IQ1) | 1.7% | 1.1% |
| Interquartile 75% (IQ3) | 3.1% | 3.9% |
| Interquartile Range (IQR) | 1.5% | 2.8% |
| Standard Deviation (Sample) | 1.3% | 2.0% |
| Standard Deviation (Population) | 1.2% | 2.0% |
Similar Demographics by Disability Age Under 5
Demographics Similar to Houma by Disability Age Under 5
In terms of disability age under 5, the demographic groups most similar to Houma are Choctaw (1.9%, a difference of 0.32%), American (1.9%, a difference of 0.47%), French Canadian (1.9%, a difference of 0.62%), Chippewa (1.9%, a difference of 0.69%), and Osage (1.8%, a difference of 2.2%).
| Demographics | Rating | Rank | Disability Age Under 5 |
| Germans | 0.0 /100 | #322 | Tragic 1.7% |
| Chickasaw | 0.0 /100 | #323 | Tragic 1.7% |
| Cherokee | 0.0 /100 | #324 | Tragic 1.8% |
| Immigrants | Portugal | 0.0 /100 | #325 | Tragic 1.8% |
| Sioux | 0.0 /100 | #326 | Tragic 1.8% |
| Osage | 0.0 /100 | #327 | Tragic 1.8% |
| Americans | 0.0 /100 | #328 | Tragic 1.9% |
| Houma | 0.0 /100 | #329 | Tragic 1.9% |
| Choctaw | 0.0 /100 | #330 | Tragic 1.9% |
| French Canadians | 0.0 /100 | #331 | Tragic 1.9% |
| Chippewa | 0.0 /100 | #332 | Tragic 1.9% |
| Dutch West Indians | 0.0 /100 | #333 | Tragic 1.9% |
| Natives/Alaskans | 0.0 /100 | #334 | Tragic 1.9% |
| Pennsylvania Germans | 0.0 /100 | #335 | Tragic 1.9% |
| Paraguayans | 0.0 /100 | #336 | Tragic 2.0% |
Demographics Similar to Navajo by Disability Age Under 5
In terms of disability age under 5, the demographic groups most similar to Navajo are Scottish (1.6%, a difference of 0.14%), Creek (1.6%, a difference of 0.21%), Blackfeet (1.6%, a difference of 0.25%), Seminole (1.6%, a difference of 0.40%), and Cape Verdean (1.7%, a difference of 0.63%).
| Demographics | Rating | Rank | Disability Age Under 5 |
| German Russians | 0.0 /100 | #301 | Tragic 1.6% |
| Welsh | 0.0 /100 | #302 | Tragic 1.6% |
| Swiss | 0.0 /100 | #303 | Tragic 1.6% |
| Seminole | 0.0 /100 | #304 | Tragic 1.6% |
| Blackfeet | 0.0 /100 | #305 | Tragic 1.6% |
| Creek | 0.0 /100 | #306 | Tragic 1.6% |
| Scottish | 0.0 /100 | #307 | Tragic 1.6% |
| Navajo | 0.0 /100 | #308 | Tragic 1.6% |
| Cape Verdeans | 0.0 /100 | #309 | Tragic 1.7% |
| Whites/Caucasians | 0.0 /100 | #310 | Tragic 1.7% |
| English | 0.0 /100 | #311 | Tragic 1.7% |
| Puerto Ricans | 0.0 /100 | #312 | Tragic 1.7% |
| Celtics | 0.0 /100 | #313 | Tragic 1.7% |
| Norwegians | 0.0 /100 | #314 | Tragic 1.7% |
| Dutch | 0.0 /100 | #315 | Tragic 1.7% |