Immigrants from Ireland vs Uruguayan Cognitive Disability
COMPARE
Immigrants from Ireland
Uruguayan
Cognitive Disability
Cognitive Disability Comparison
Immigrants from Ireland
Uruguayans
16.1%
COGNITIVE DISABILITY
100.0/ 100
METRIC RATING
7th/ 347
METRIC RANK
16.8%
COGNITIVE DISABILITY
97.2/ 100
METRIC RATING
111th/ 347
METRIC RANK
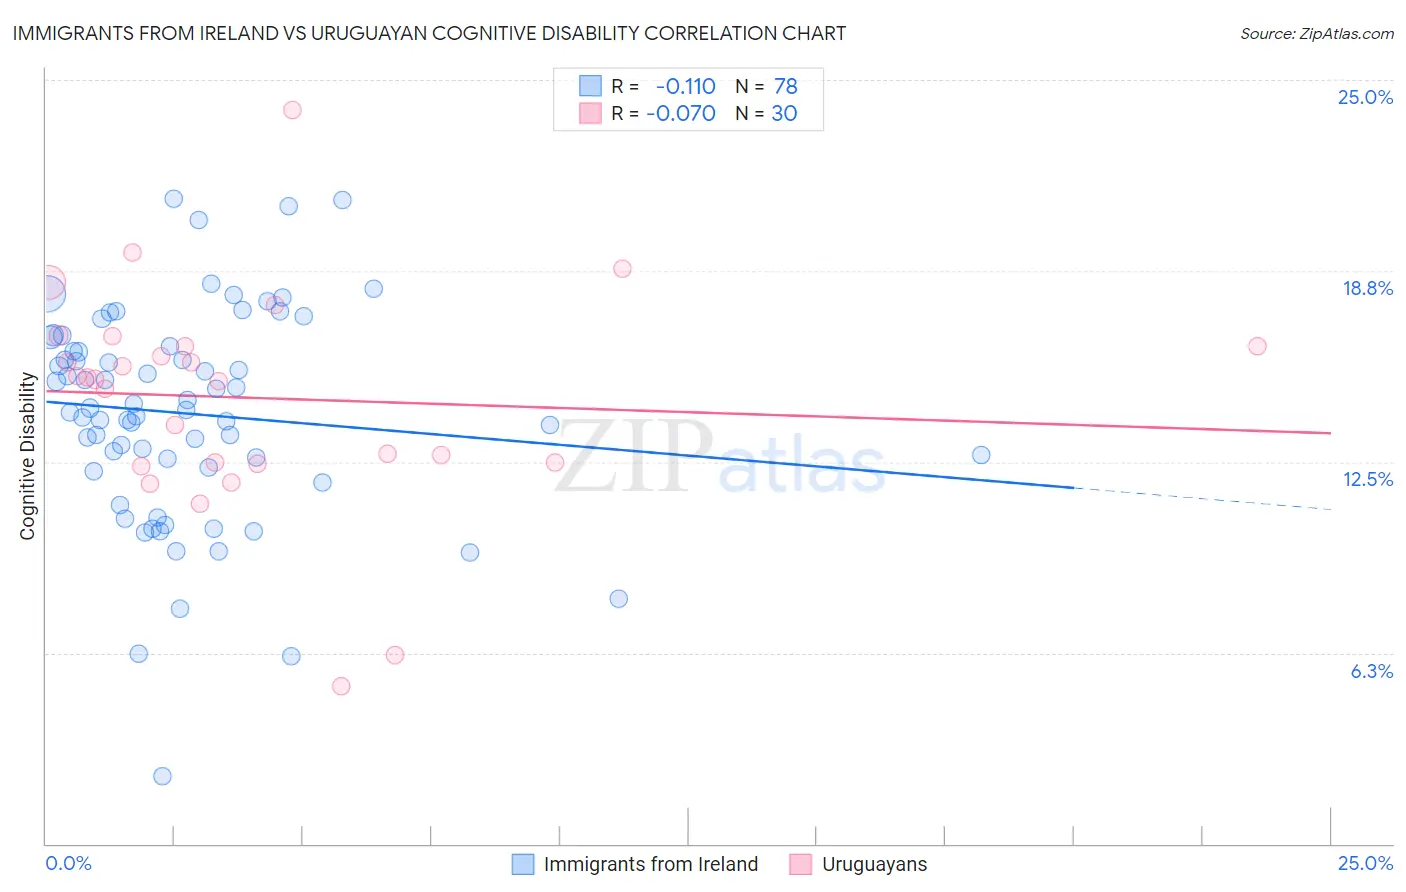
Immigrants from Ireland vs Uruguayan Cognitive Disability Correlation Chart
The statistical analysis conducted on geographies consisting of 240,767,768 people shows a poor negative correlation between the proportion of Immigrants from Ireland and percentage of population with cognitive disability in the United States with a correlation coefficient (R) of -0.110 and weighted average of 16.1%. Similarly, the statistical analysis conducted on geographies consisting of 144,784,951 people shows a slight negative correlation between the proportion of Uruguayans and percentage of population with cognitive disability in the United States with a correlation coefficient (R) of -0.070 and weighted average of 16.8%, a difference of 4.4%.
Cognitive Disability Correlation Summary
| Measurement | Immigrants from Ireland | Uruguayan |
| Minimum | 2.2% | 5.2% |
| Maximum | 21.1% | 24.0% |
| Range | 18.9% | 18.9% |
| Mean | 14.1% | 14.6% |
| Median | 14.2% | 15.2% |
| Interquartile 25% (IQ1) | 12.3% | 12.5% |
| Interquartile 75% (IQ3) | 16.3% | 16.3% |
| Interquartile Range (IQR) | 4.0% | 3.8% |
| Standard Deviation (Sample) | 3.5% | 3.7% |
| Standard Deviation (Population) | 3.5% | 3.6% |
Similar Demographics by Cognitive Disability
Demographics Similar to Immigrants from Ireland by Cognitive Disability
In terms of cognitive disability, the demographic groups most similar to Immigrants from Ireland are Immigrants from Poland (16.1%, a difference of 0.020%), Thai (16.1%, a difference of 0.11%), Assyrian/Chaldean/Syriac (16.2%, a difference of 0.34%), Immigrants from Scotland (16.2%, a difference of 0.38%), and Immigrants from Czechoslovakia (16.2%, a difference of 0.47%).
| Demographics | Rating | Rank | Cognitive Disability |
| Immigrants | Taiwan | 100.0 /100 | #1 | Exceptional 15.7% |
| Immigrants | India | 100.0 /100 | #2 | Exceptional 15.9% |
| Chinese | 100.0 /100 | #3 | Exceptional 15.9% |
| Immigrants | Lithuania | 100.0 /100 | #4 | Exceptional 16.0% |
| Immigrants | Hong Kong | 100.0 /100 | #5 | Exceptional 16.0% |
| Thais | 100.0 /100 | #6 | Exceptional 16.1% |
| Immigrants | Ireland | 100.0 /100 | #7 | Exceptional 16.1% |
| Immigrants | Poland | 100.0 /100 | #8 | Exceptional 16.1% |
| Assyrians/Chaldeans/Syriacs | 100.0 /100 | #9 | Exceptional 16.2% |
| Immigrants | Scotland | 100.0 /100 | #10 | Exceptional 16.2% |
| Immigrants | Czechoslovakia | 100.0 /100 | #11 | Exceptional 16.2% |
| Maltese | 100.0 /100 | #12 | Exceptional 16.2% |
| Lithuanians | 100.0 /100 | #13 | Exceptional 16.3% |
| Immigrants | Austria | 100.0 /100 | #14 | Exceptional 16.3% |
| Immigrants | Greece | 100.0 /100 | #15 | Exceptional 16.3% |
Demographics Similar to Uruguayans by Cognitive Disability
In terms of cognitive disability, the demographic groups most similar to Uruguayans are Arapaho (16.8%, a difference of 0.010%), Albanian (16.8%, a difference of 0.020%), Indian (Asian) (16.8%, a difference of 0.020%), Immigrants from Sri Lanka (16.8%, a difference of 0.030%), and Korean (16.8%, a difference of 0.030%).
| Demographics | Rating | Rank | Cognitive Disability |
| Palestinians | 98.0 /100 | #104 | Exceptional 16.8% |
| Immigrants | Eastern Asia | 97.9 /100 | #105 | Exceptional 16.8% |
| Northern Europeans | 97.8 /100 | #106 | Exceptional 16.8% |
| Immigrants | Nicaragua | 97.8 /100 | #107 | Exceptional 16.8% |
| Canadians | 97.5 /100 | #108 | Exceptional 16.8% |
| Albanians | 97.3 /100 | #109 | Exceptional 16.8% |
| Arapaho | 97.3 /100 | #110 | Exceptional 16.8% |
| Uruguayans | 97.2 /100 | #111 | Exceptional 16.8% |
| Indians (Asian) | 97.2 /100 | #112 | Exceptional 16.8% |
| Immigrants | Sri Lanka | 97.1 /100 | #113 | Exceptional 16.8% |
| Koreans | 97.1 /100 | #114 | Exceptional 16.8% |
| Yup'ik | 96.9 /100 | #115 | Exceptional 16.9% |
| Inupiat | 96.5 /100 | #116 | Exceptional 16.9% |
| Immigrants | Japan | 96.2 /100 | #117 | Exceptional 16.9% |
| Immigrants | Denmark | 96.2 /100 | #118 | Exceptional 16.9% |