White/Caucasian vs American Cognitive Disability
COMPARE
White/Caucasian
American
Cognitive Disability
Cognitive Disability Comparison
Whites/Caucasians
Americans
17.0%
COGNITIVE DISABILITY
92.1/ 100
METRIC RATING
132nd/ 347
METRIC RANK
17.2%
COGNITIVE DISABILITY
72.2/ 100
METRIC RATING
161st/ 347
METRIC RANK
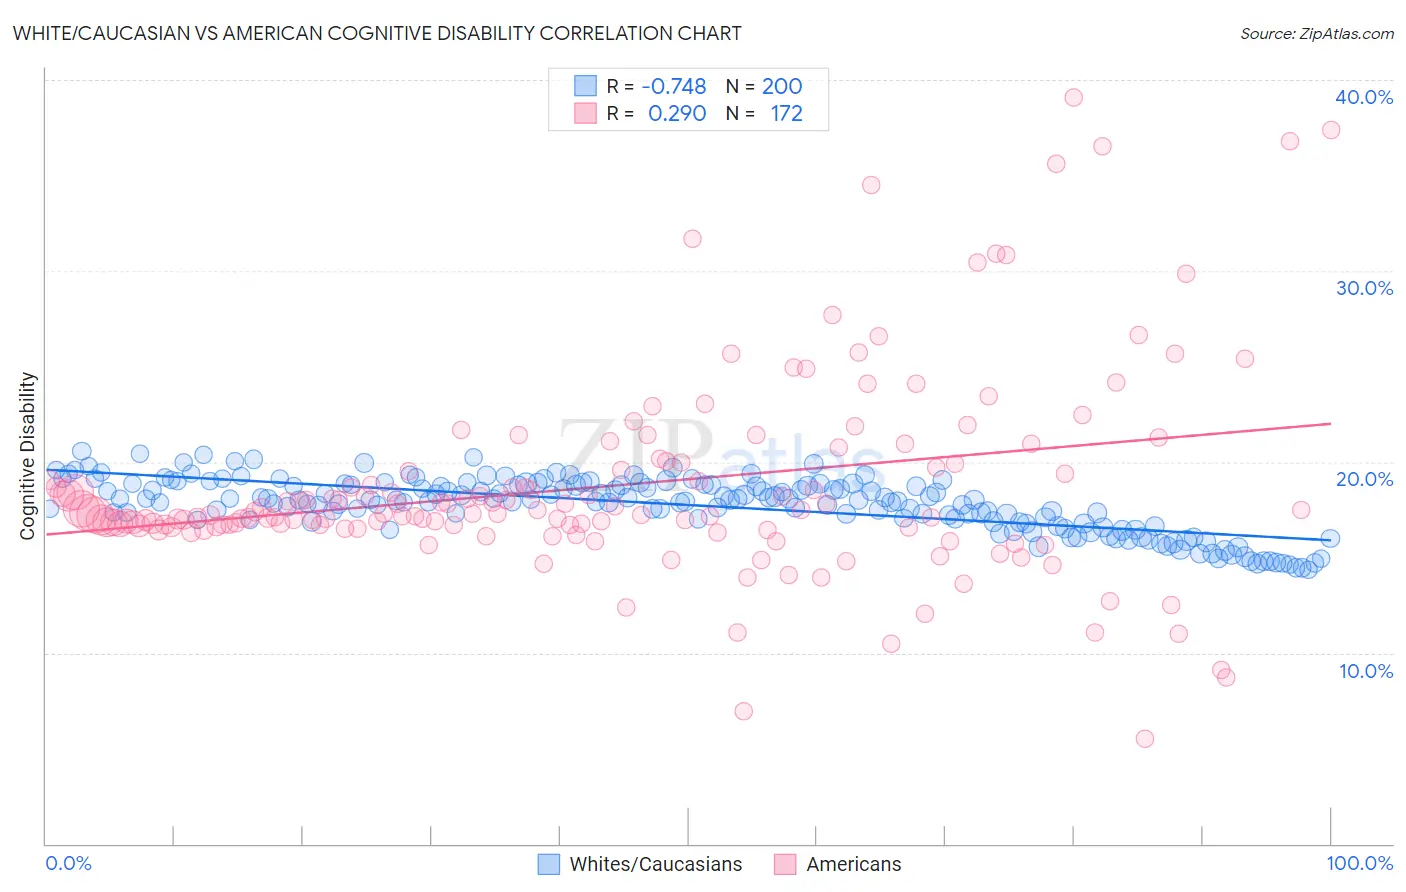
White/Caucasian vs American Cognitive Disability Correlation Chart
The statistical analysis conducted on geographies consisting of 584,856,433 people shows a strong negative correlation between the proportion of Whites/Caucasians and percentage of population with cognitive disability in the United States with a correlation coefficient (R) of -0.748 and weighted average of 17.0%. Similarly, the statistical analysis conducted on geographies consisting of 581,739,029 people shows a weak positive correlation between the proportion of Americans and percentage of population with cognitive disability in the United States with a correlation coefficient (R) of 0.290 and weighted average of 17.2%, a difference of 1.1%.
Cognitive Disability Correlation Summary
| Measurement | White/Caucasian | American |
| Minimum | 14.3% | 5.5% |
| Maximum | 20.5% | 39.1% |
| Range | 6.2% | 33.6% |
| Mean | 17.7% | 18.8% |
| Median | 18.0% | 17.3% |
| Interquartile 25% (IQ1) | 16.9% | 16.6% |
| Interquartile 75% (IQ3) | 18.8% | 19.8% |
| Interquartile Range (IQR) | 1.9% | 3.2% |
| Standard Deviation (Sample) | 1.4% | 5.3% |
| Standard Deviation (Population) | 1.4% | 5.3% |
Similar Demographics by Cognitive Disability
Demographics Similar to Whites/Caucasians by Cognitive Disability
In terms of cognitive disability, the demographic groups most similar to Whites/Caucasians are Immigrants from Germany (17.0%, a difference of 0.0%), Immigrants from Vietnam (17.0%, a difference of 0.020%), Immigrants from Jordan (17.0%, a difference of 0.030%), Immigrants from Chile (17.0%, a difference of 0.040%), and Immigrants from Uruguay (17.0%, a difference of 0.080%).
| Demographics | Rating | Rank | Cognitive Disability |
| Scandinavians | 94.1 /100 | #125 | Exceptional 16.9% |
| Europeans | 93.4 /100 | #126 | Exceptional 17.0% |
| Immigrants | Costa Rica | 93.1 /100 | #127 | Exceptional 17.0% |
| Nicaraguans | 93.0 /100 | #128 | Exceptional 17.0% |
| Immigrants | Uruguay | 92.9 /100 | #129 | Exceptional 17.0% |
| Immigrants | Vietnam | 92.4 /100 | #130 | Exceptional 17.0% |
| Immigrants | Germany | 92.1 /100 | #131 | Exceptional 17.0% |
| Whites/Caucasians | 92.1 /100 | #132 | Exceptional 17.0% |
| Immigrants | Jordan | 91.9 /100 | #133 | Exceptional 17.0% |
| Immigrants | Chile | 91.7 /100 | #134 | Exceptional 17.0% |
| Lebanese | 91.3 /100 | #135 | Exceptional 17.0% |
| Israelis | 91.0 /100 | #136 | Exceptional 17.0% |
| Immigrants | Norway | 90.9 /100 | #137 | Exceptional 17.0% |
| Welsh | 90.8 /100 | #138 | Exceptional 17.0% |
| French | 90.0 /100 | #139 | Excellent 17.0% |
Demographics Similar to Americans by Cognitive Disability
In terms of cognitive disability, the demographic groups most similar to Americans are Australian (17.2%, a difference of 0.010%), Yugoslavian (17.2%, a difference of 0.020%), Immigrants from Switzerland (17.2%, a difference of 0.020%), Immigrants from Latvia (17.2%, a difference of 0.040%), and Celtic (17.1%, a difference of 0.070%).
| Demographics | Rating | Rank | Cognitive Disability |
| Immigrants | Malaysia | 79.3 /100 | #154 | Good 17.1% |
| Brazilians | 78.9 /100 | #155 | Good 17.1% |
| Sri Lankans | 78.9 /100 | #156 | Good 17.1% |
| Immigrants | Australia | 76.0 /100 | #157 | Good 17.1% |
| Celtics | 74.1 /100 | #158 | Good 17.1% |
| Immigrants | Latvia | 73.2 /100 | #159 | Good 17.2% |
| Australians | 72.4 /100 | #160 | Good 17.2% |
| Americans | 72.2 /100 | #161 | Good 17.2% |
| Yugoslavians | 71.6 /100 | #162 | Good 17.2% |
| Immigrants | Switzerland | 71.5 /100 | #163 | Good 17.2% |
| Armenians | 70.1 /100 | #164 | Good 17.2% |
| Immigrants | Albania | 64.9 /100 | #165 | Good 17.2% |
| Immigrants | Ecuador | 64.4 /100 | #166 | Good 17.2% |
| Immigrants | Syria | 63.5 /100 | #167 | Good 17.2% |
| Immigrants | Immigrants | 62.5 /100 | #168 | Good 17.2% |