White/Caucasian vs Hopi Cognitive Disability
COMPARE
White/Caucasian
Hopi
Cognitive Disability
Cognitive Disability Comparison
Whites/Caucasians
Hopi
17.0%
COGNITIVE DISABILITY
92.1/ 100
METRIC RATING
132nd/ 347
METRIC RANK
17.9%
COGNITIVE DISABILITY
0.6/ 100
METRIC RATING
253rd/ 347
METRIC RANK
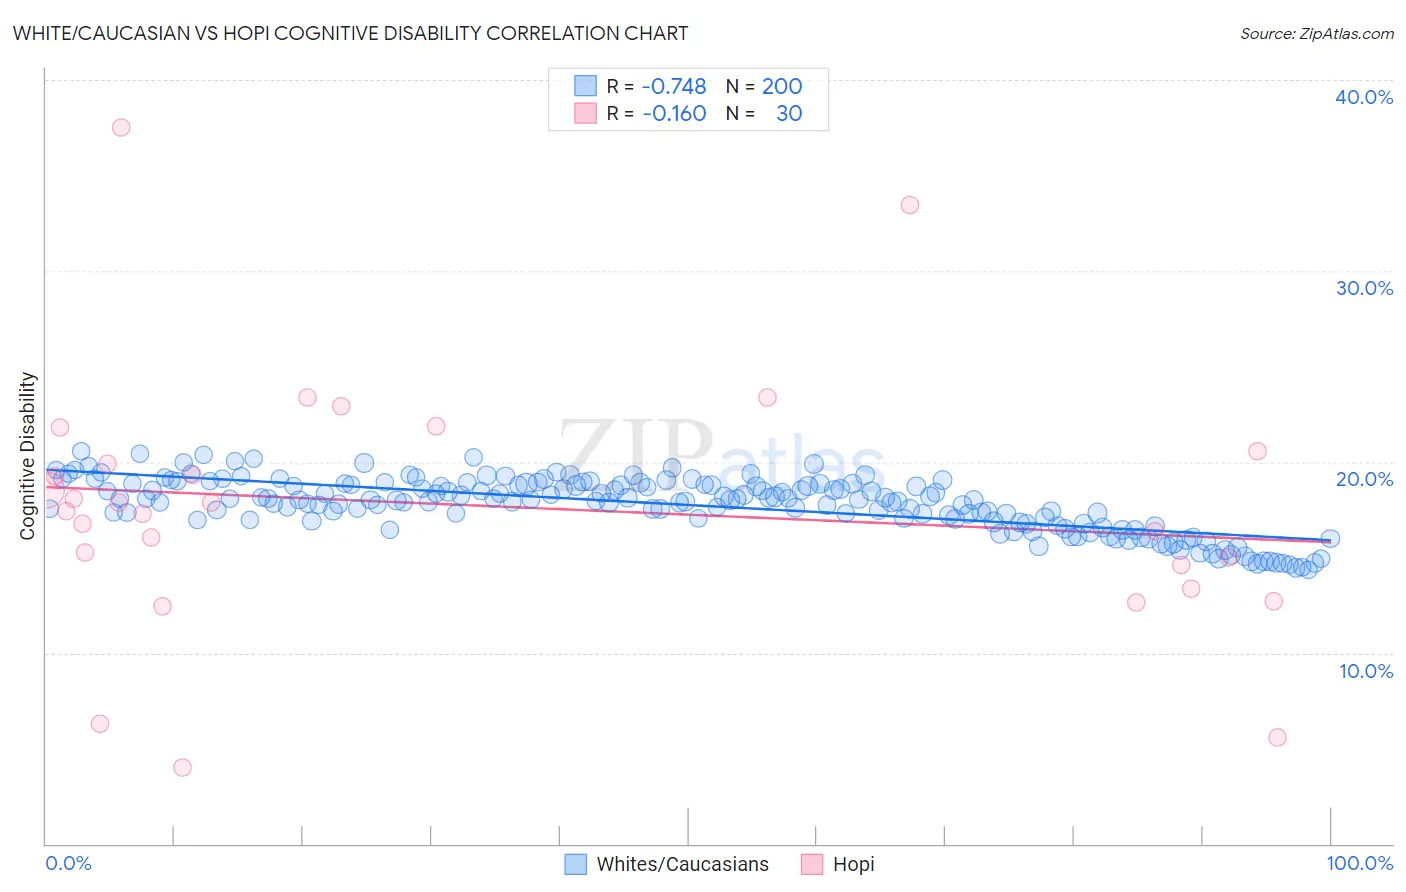
White/Caucasian vs Hopi Cognitive Disability Correlation Chart
The statistical analysis conducted on geographies consisting of 584,856,433 people shows a strong negative correlation between the proportion of Whites/Caucasians and percentage of population with cognitive disability in the United States with a correlation coefficient (R) of -0.748 and weighted average of 17.0%. Similarly, the statistical analysis conducted on geographies consisting of 74,733,532 people shows a poor negative correlation between the proportion of Hopi and percentage of population with cognitive disability in the United States with a correlation coefficient (R) of -0.160 and weighted average of 17.9%, a difference of 5.5%.
Cognitive Disability Correlation Summary
| Measurement | White/Caucasian | Hopi |
| Minimum | 14.3% | 4.0% |
| Maximum | 20.5% | 37.5% |
| Range | 6.2% | 33.5% |
| Mean | 17.7% | 17.7% |
| Median | 18.0% | 17.6% |
| Interquartile 25% (IQ1) | 16.9% | 14.6% |
| Interquartile 75% (IQ3) | 18.8% | 20.5% |
| Interquartile Range (IQR) | 1.9% | 6.0% |
| Standard Deviation (Sample) | 1.4% | 6.9% |
| Standard Deviation (Population) | 1.4% | 6.8% |
Similar Demographics by Cognitive Disability
Demographics Similar to Whites/Caucasians by Cognitive Disability
In terms of cognitive disability, the demographic groups most similar to Whites/Caucasians are Immigrants from Germany (17.0%, a difference of 0.0%), Immigrants from Vietnam (17.0%, a difference of 0.020%), Immigrants from Jordan (17.0%, a difference of 0.030%), Immigrants from Chile (17.0%, a difference of 0.040%), and Immigrants from Uruguay (17.0%, a difference of 0.080%).
| Demographics | Rating | Rank | Cognitive Disability |
| Scandinavians | 94.1 /100 | #125 | Exceptional 16.9% |
| Europeans | 93.4 /100 | #126 | Exceptional 17.0% |
| Immigrants | Costa Rica | 93.1 /100 | #127 | Exceptional 17.0% |
| Nicaraguans | 93.0 /100 | #128 | Exceptional 17.0% |
| Immigrants | Uruguay | 92.9 /100 | #129 | Exceptional 17.0% |
| Immigrants | Vietnam | 92.4 /100 | #130 | Exceptional 17.0% |
| Immigrants | Germany | 92.1 /100 | #131 | Exceptional 17.0% |
| Whites/Caucasians | 92.1 /100 | #132 | Exceptional 17.0% |
| Immigrants | Jordan | 91.9 /100 | #133 | Exceptional 17.0% |
| Immigrants | Chile | 91.7 /100 | #134 | Exceptional 17.0% |
| Lebanese | 91.3 /100 | #135 | Exceptional 17.0% |
| Israelis | 91.0 /100 | #136 | Exceptional 17.0% |
| Immigrants | Norway | 90.9 /100 | #137 | Exceptional 17.0% |
| Welsh | 90.8 /100 | #138 | Exceptional 17.0% |
| French | 90.0 /100 | #139 | Excellent 17.0% |
Demographics Similar to Hopi by Cognitive Disability
In terms of cognitive disability, the demographic groups most similar to Hopi are Hispanic or Latino (17.9%, a difference of 0.0%), Immigrants from Grenada (17.9%, a difference of 0.010%), Immigrants from the Azores (17.9%, a difference of 0.010%), Bahamian (17.9%, a difference of 0.010%), and Cree (17.9%, a difference of 0.030%).
| Demographics | Rating | Rank | Cognitive Disability |
| Immigrants | Thailand | 0.8 /100 | #246 | Tragic 17.9% |
| Samoans | 0.7 /100 | #247 | Tragic 17.9% |
| French American Indians | 0.7 /100 | #248 | Tragic 17.9% |
| Cree | 0.7 /100 | #249 | Tragic 17.9% |
| Immigrants | Ethiopia | 0.7 /100 | #250 | Tragic 17.9% |
| Malaysians | 0.6 /100 | #251 | Tragic 17.9% |
| Immigrants | Grenada | 0.6 /100 | #252 | Tragic 17.9% |
| Hopi | 0.6 /100 | #253 | Tragic 17.9% |
| Hispanics or Latinos | 0.6 /100 | #254 | Tragic 17.9% |
| Immigrants | Azores | 0.6 /100 | #255 | Tragic 17.9% |
| Bahamians | 0.6 /100 | #256 | Tragic 17.9% |
| Mexican American Indians | 0.6 /100 | #257 | Tragic 17.9% |
| Immigrants | Armenia | 0.6 /100 | #258 | Tragic 17.9% |
| Ethiopians | 0.5 /100 | #259 | Tragic 17.9% |
| Immigrants | Belize | 0.5 /100 | #260 | Tragic 17.9% |