Nicaraguan vs Uruguayan Cognitive Disability
COMPARE
Nicaraguan
Uruguayan
Cognitive Disability
Cognitive Disability Comparison
Nicaraguans
Uruguayans
17.0%
COGNITIVE DISABILITY
93.0/ 100
METRIC RATING
128th/ 347
METRIC RANK
16.8%
COGNITIVE DISABILITY
97.2/ 100
METRIC RATING
111th/ 347
METRIC RANK
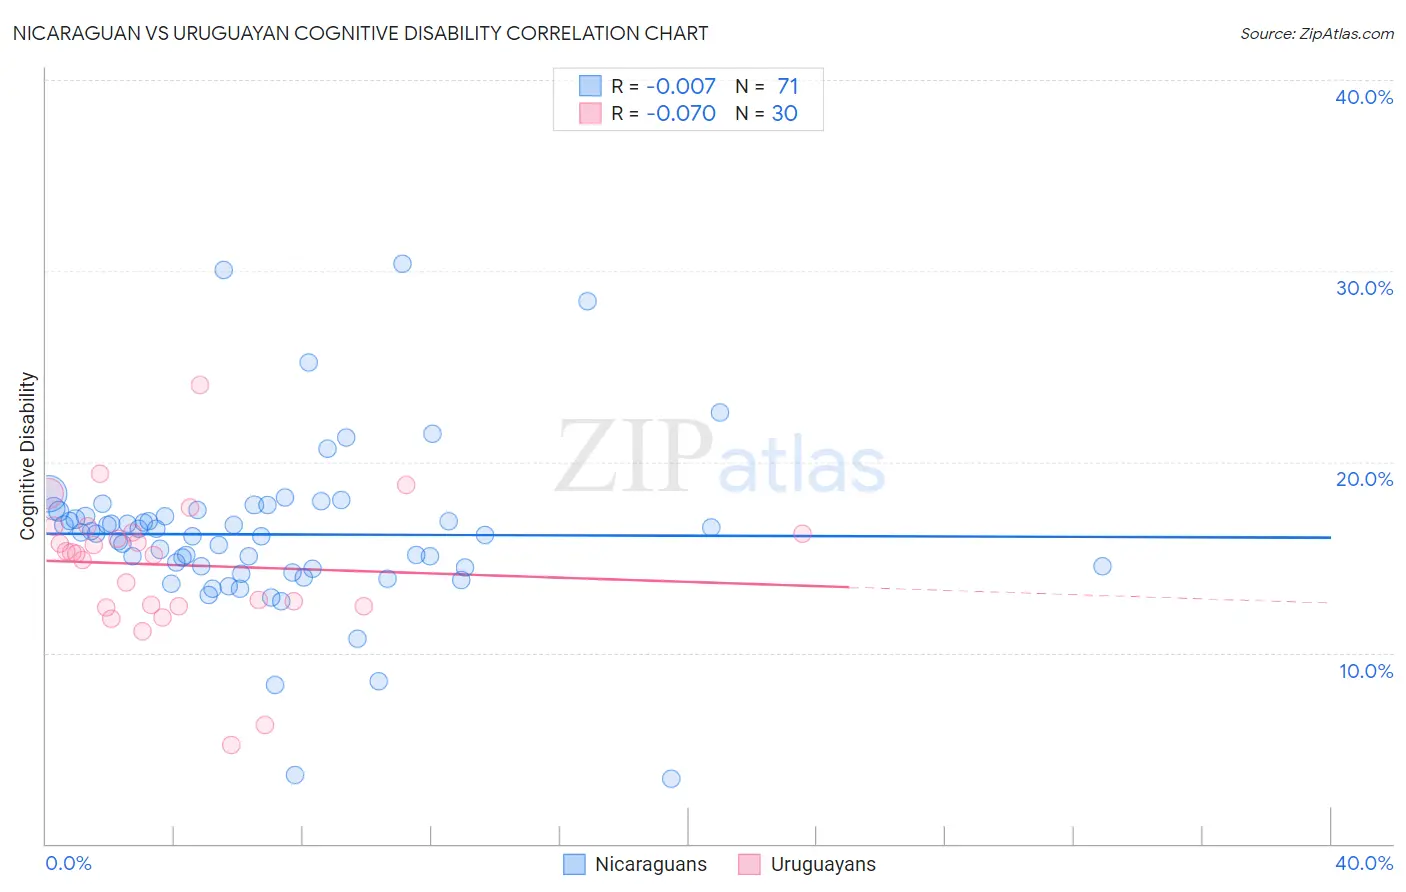
Nicaraguan vs Uruguayan Cognitive Disability Correlation Chart
The statistical analysis conducted on geographies consisting of 285,693,430 people shows no correlation between the proportion of Nicaraguans and percentage of population with cognitive disability in the United States with a correlation coefficient (R) of -0.007 and weighted average of 17.0%. Similarly, the statistical analysis conducted on geographies consisting of 144,784,951 people shows a slight negative correlation between the proportion of Uruguayans and percentage of population with cognitive disability in the United States with a correlation coefficient (R) of -0.070 and weighted average of 16.8%, a difference of 0.71%.
Cognitive Disability Correlation Summary
| Measurement | Nicaraguan | Uruguayan |
| Minimum | 3.4% | 5.2% |
| Maximum | 30.4% | 24.0% |
| Range | 26.9% | 18.9% |
| Mean | 16.2% | 14.6% |
| Median | 16.2% | 15.2% |
| Interquartile 25% (IQ1) | 14.4% | 12.5% |
| Interquartile 75% (IQ3) | 17.4% | 16.3% |
| Interquartile Range (IQR) | 3.0% | 3.8% |
| Standard Deviation (Sample) | 4.4% | 3.7% |
| Standard Deviation (Population) | 4.4% | 3.6% |
Demographics Similar to Nicaraguans and Uruguayans by Cognitive Disability
In terms of cognitive disability, the demographic groups most similar to Nicaraguans are Immigrants from Costa Rica (17.0%, a difference of 0.010%), Immigrants from Uruguay (17.0%, a difference of 0.010%), European (17.0%, a difference of 0.050%), Scandinavian (16.9%, a difference of 0.14%), and Turkish (16.9%, a difference of 0.19%). Similarly, the demographic groups most similar to Uruguayans are Arapaho (16.8%, a difference of 0.010%), Albanian (16.8%, a difference of 0.020%), Indian (Asian) (16.8%, a difference of 0.020%), Immigrants from Sri Lanka (16.8%, a difference of 0.030%), and Korean (16.8%, a difference of 0.030%).
| Demographics | Rating | Rank | Cognitive Disability |
| Albanians | 97.3 /100 | #109 | Exceptional 16.8% |
| Arapaho | 97.3 /100 | #110 | Exceptional 16.8% |
| Uruguayans | 97.2 /100 | #111 | Exceptional 16.8% |
| Indians (Asian) | 97.2 /100 | #112 | Exceptional 16.8% |
| Immigrants | Sri Lanka | 97.1 /100 | #113 | Exceptional 16.8% |
| Koreans | 97.1 /100 | #114 | Exceptional 16.8% |
| Yup'ik | 96.9 /100 | #115 | Exceptional 16.9% |
| Inupiat | 96.5 /100 | #116 | Exceptional 16.9% |
| Immigrants | Japan | 96.2 /100 | #117 | Exceptional 16.9% |
| Immigrants | Denmark | 96.2 /100 | #118 | Exceptional 16.9% |
| South Africans | 95.5 /100 | #119 | Exceptional 16.9% |
| Scottish | 95.0 /100 | #120 | Exceptional 16.9% |
| Immigrants | China | 94.9 /100 | #121 | Exceptional 16.9% |
| Immigrants | Western Europe | 94.8 /100 | #122 | Exceptional 16.9% |
| Portuguese | 94.7 /100 | #123 | Exceptional 16.9% |
| Turks | 94.5 /100 | #124 | Exceptional 16.9% |
| Scandinavians | 94.1 /100 | #125 | Exceptional 16.9% |
| Europeans | 93.4 /100 | #126 | Exceptional 17.0% |
| Immigrants | Costa Rica | 93.1 /100 | #127 | Exceptional 17.0% |
| Nicaraguans | 93.0 /100 | #128 | Exceptional 17.0% |
| Immigrants | Uruguay | 92.9 /100 | #129 | Exceptional 17.0% |