White/Caucasian vs Belgian Cognitive Disability
COMPARE
White/Caucasian
Belgian
Cognitive Disability
Cognitive Disability Comparison
Whites/Caucasians
Belgians
17.0%
COGNITIVE DISABILITY
92.1/ 100
METRIC RATING
132nd/ 347
METRIC RANK
16.7%
COGNITIVE DISABILITY
99.1/ 100
METRIC RATING
84th/ 347
METRIC RANK
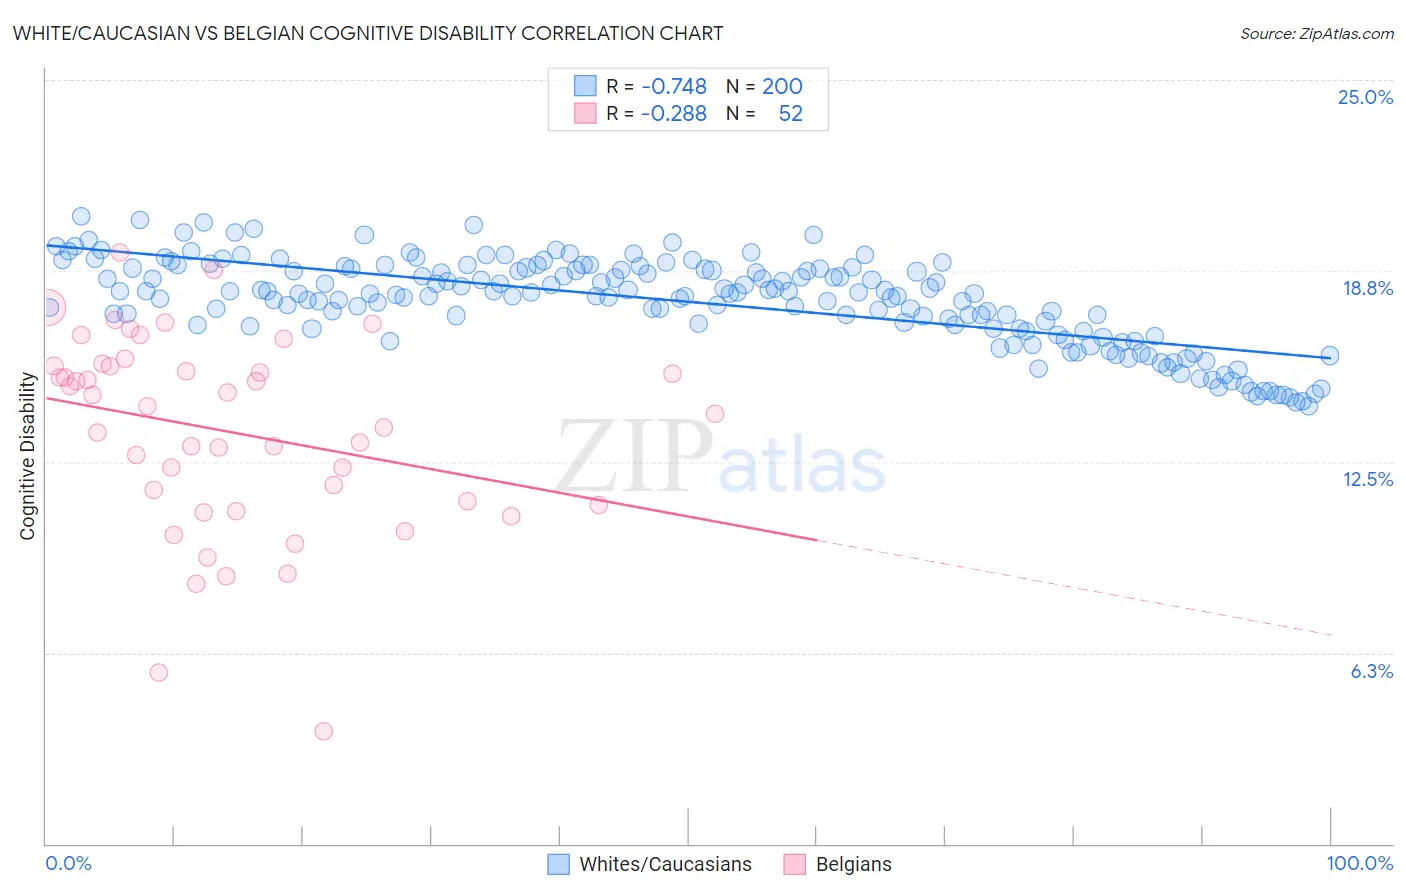
White/Caucasian vs Belgian Cognitive Disability Correlation Chart
The statistical analysis conducted on geographies consisting of 584,856,433 people shows a strong negative correlation between the proportion of Whites/Caucasians and percentage of population with cognitive disability in the United States with a correlation coefficient (R) of -0.748 and weighted average of 17.0%. Similarly, the statistical analysis conducted on geographies consisting of 355,993,312 people shows a weak negative correlation between the proportion of Belgians and percentage of population with cognitive disability in the United States with a correlation coefficient (R) of -0.288 and weighted average of 16.7%, a difference of 1.7%.
Cognitive Disability Correlation Summary
| Measurement | White/Caucasian | Belgian |
| Minimum | 14.3% | 3.7% |
| Maximum | 20.5% | 19.4% |
| Range | 6.2% | 15.7% |
| Mean | 17.7% | 13.5% |
| Median | 18.0% | 14.2% |
| Interquartile 25% (IQ1) | 16.9% | 11.1% |
| Interquartile 75% (IQ3) | 18.8% | 15.6% |
| Interquartile Range (IQR) | 1.9% | 4.5% |
| Standard Deviation (Sample) | 1.4% | 3.2% |
| Standard Deviation (Population) | 1.4% | 3.2% |
Similar Demographics by Cognitive Disability
Demographics Similar to Whites/Caucasians by Cognitive Disability
In terms of cognitive disability, the demographic groups most similar to Whites/Caucasians are Immigrants from Germany (17.0%, a difference of 0.0%), Immigrants from Vietnam (17.0%, a difference of 0.020%), Immigrants from Jordan (17.0%, a difference of 0.030%), Immigrants from Chile (17.0%, a difference of 0.040%), and Immigrants from Uruguay (17.0%, a difference of 0.080%).
| Demographics | Rating | Rank | Cognitive Disability |
| Scandinavians | 94.1 /100 | #125 | Exceptional 16.9% |
| Europeans | 93.4 /100 | #126 | Exceptional 17.0% |
| Immigrants | Costa Rica | 93.1 /100 | #127 | Exceptional 17.0% |
| Nicaraguans | 93.0 /100 | #128 | Exceptional 17.0% |
| Immigrants | Uruguay | 92.9 /100 | #129 | Exceptional 17.0% |
| Immigrants | Vietnam | 92.4 /100 | #130 | Exceptional 17.0% |
| Immigrants | Germany | 92.1 /100 | #131 | Exceptional 17.0% |
| Whites/Caucasians | 92.1 /100 | #132 | Exceptional 17.0% |
| Immigrants | Jordan | 91.9 /100 | #133 | Exceptional 17.0% |
| Immigrants | Chile | 91.7 /100 | #134 | Exceptional 17.0% |
| Lebanese | 91.3 /100 | #135 | Exceptional 17.0% |
| Israelis | 91.0 /100 | #136 | Exceptional 17.0% |
| Immigrants | Norway | 90.9 /100 | #137 | Exceptional 17.0% |
| Welsh | 90.8 /100 | #138 | Exceptional 17.0% |
| French | 90.0 /100 | #139 | Excellent 17.0% |
Demographics Similar to Belgians by Cognitive Disability
In terms of cognitive disability, the demographic groups most similar to Belgians are Serbian (16.7%, a difference of 0.020%), Immigrants from Moldova (16.7%, a difference of 0.020%), Immigrants from South Africa (16.7%, a difference of 0.050%), Native Hawaiian (16.7%, a difference of 0.060%), and Swiss (16.7%, a difference of 0.090%).
| Demographics | Rating | Rank | Cognitive Disability |
| Immigrants | Hungary | 99.3 /100 | #77 | Exceptional 16.7% |
| Peruvians | 99.3 /100 | #78 | Exceptional 16.7% |
| Immigrants | Bulgaria | 99.3 /100 | #79 | Exceptional 16.7% |
| Egyptians | 99.2 /100 | #80 | Exceptional 16.7% |
| Immigrants | Netherlands | 99.2 /100 | #81 | Exceptional 16.7% |
| Swiss | 99.2 /100 | #82 | Exceptional 16.7% |
| Serbians | 99.1 /100 | #83 | Exceptional 16.7% |
| Belgians | 99.1 /100 | #84 | Exceptional 16.7% |
| Immigrants | Moldova | 99.1 /100 | #85 | Exceptional 16.7% |
| Immigrants | South Africa | 99.0 /100 | #86 | Exceptional 16.7% |
| Native Hawaiians | 99.0 /100 | #87 | Exceptional 16.7% |
| Immigrants | Philippines | 99.0 /100 | #88 | Exceptional 16.7% |
| Immigrants | Egypt | 98.8 /100 | #89 | Exceptional 16.7% |
| South Americans | 98.8 /100 | #90 | Exceptional 16.7% |
| Danes | 98.8 /100 | #91 | Exceptional 16.7% |