White/Caucasian vs Portuguese Cognitive Disability
COMPARE
White/Caucasian
Portuguese
Cognitive Disability
Cognitive Disability Comparison
Whites/Caucasians
Portuguese
17.0%
COGNITIVE DISABILITY
92.1/ 100
METRIC RATING
132nd/ 347
METRIC RANK
16.9%
COGNITIVE DISABILITY
94.7/ 100
METRIC RATING
123rd/ 347
METRIC RANK
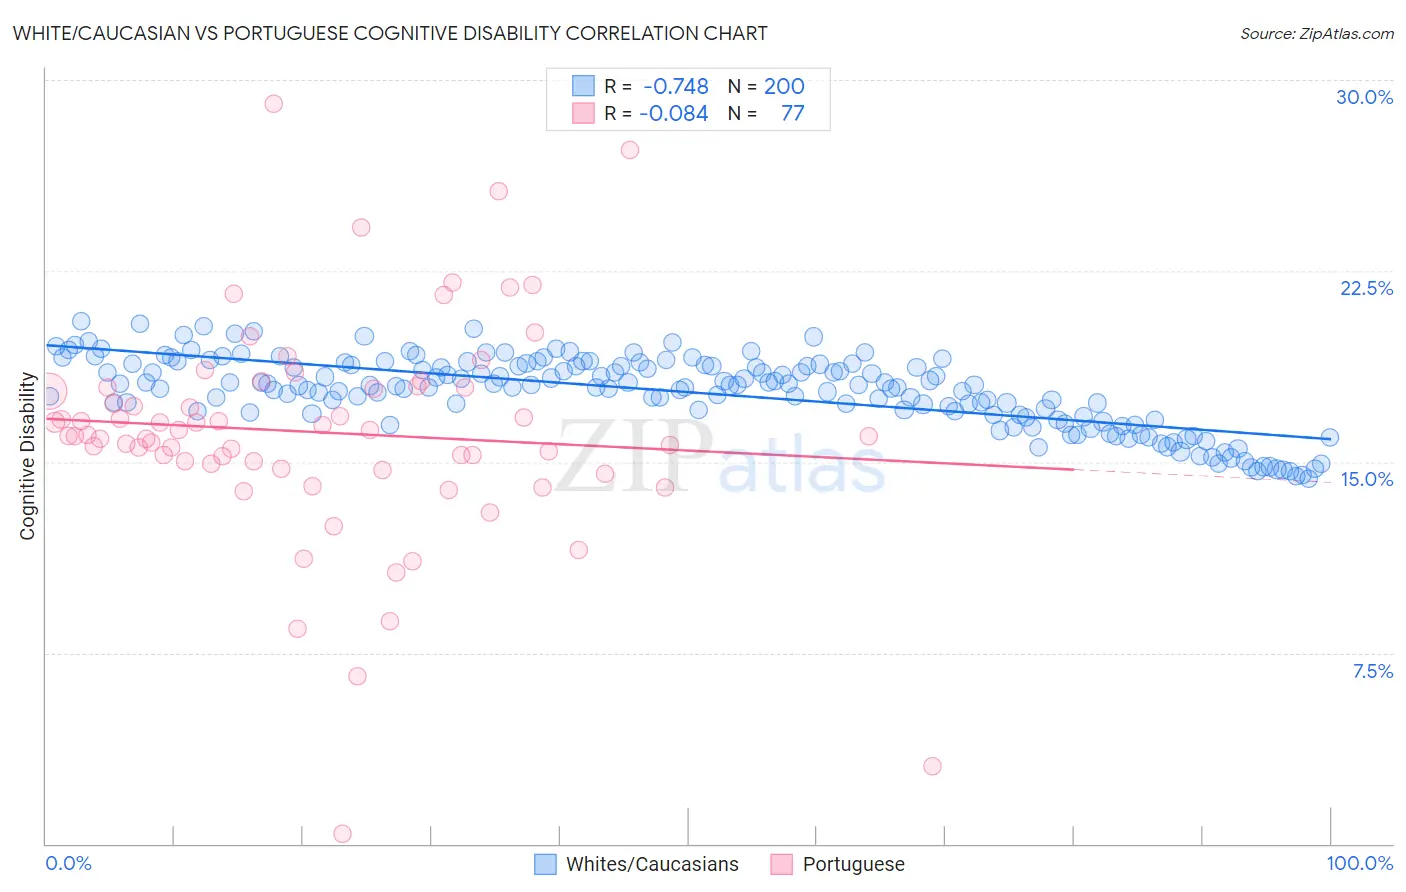
White/Caucasian vs Portuguese Cognitive Disability Correlation Chart
The statistical analysis conducted on geographies consisting of 584,856,433 people shows a strong negative correlation between the proportion of Whites/Caucasians and percentage of population with cognitive disability in the United States with a correlation coefficient (R) of -0.748 and weighted average of 17.0%. Similarly, the statistical analysis conducted on geographies consisting of 450,269,576 people shows a slight negative correlation between the proportion of Portuguese and percentage of population with cognitive disability in the United States with a correlation coefficient (R) of -0.084 and weighted average of 16.9%, a difference of 0.31%.
Cognitive Disability Correlation Summary
| Measurement | White/Caucasian | Portuguese |
| Minimum | 14.3% | 0.38% |
| Maximum | 20.5% | 29.1% |
| Range | 6.2% | 28.7% |
| Mean | 17.7% | 16.2% |
| Median | 18.0% | 16.0% |
| Interquartile 25% (IQ1) | 16.9% | 14.8% |
| Interquartile 75% (IQ3) | 18.8% | 17.9% |
| Interquartile Range (IQR) | 1.9% | 3.1% |
| Standard Deviation (Sample) | 1.4% | 4.4% |
| Standard Deviation (Population) | 1.4% | 4.4% |
Demographics Similar to Whites/Caucasians and Portuguese by Cognitive Disability
In terms of cognitive disability, the demographic groups most similar to Whites/Caucasians are Immigrants from Germany (17.0%, a difference of 0.0%), Immigrants from Vietnam (17.0%, a difference of 0.020%), Immigrants from Jordan (17.0%, a difference of 0.030%), Immigrants from Chile (17.0%, a difference of 0.040%), and Immigrants from Uruguay (17.0%, a difference of 0.080%). Similarly, the demographic groups most similar to Portuguese are Immigrants from Western Europe (16.9%, a difference of 0.010%), Turkish (16.9%, a difference of 0.020%), Immigrants from China (16.9%, a difference of 0.030%), Scottish (16.9%, a difference of 0.040%), and Scandinavian (16.9%, a difference of 0.080%).
| Demographics | Rating | Rank | Cognitive Disability |
| Immigrants | Japan | 96.2 /100 | #117 | Exceptional 16.9% |
| Immigrants | Denmark | 96.2 /100 | #118 | Exceptional 16.9% |
| South Africans | 95.5 /100 | #119 | Exceptional 16.9% |
| Scottish | 95.0 /100 | #120 | Exceptional 16.9% |
| Immigrants | China | 94.9 /100 | #121 | Exceptional 16.9% |
| Immigrants | Western Europe | 94.8 /100 | #122 | Exceptional 16.9% |
| Portuguese | 94.7 /100 | #123 | Exceptional 16.9% |
| Turks | 94.5 /100 | #124 | Exceptional 16.9% |
| Scandinavians | 94.1 /100 | #125 | Exceptional 16.9% |
| Europeans | 93.4 /100 | #126 | Exceptional 17.0% |
| Immigrants | Costa Rica | 93.1 /100 | #127 | Exceptional 17.0% |
| Nicaraguans | 93.0 /100 | #128 | Exceptional 17.0% |
| Immigrants | Uruguay | 92.9 /100 | #129 | Exceptional 17.0% |
| Immigrants | Vietnam | 92.4 /100 | #130 | Exceptional 17.0% |
| Immigrants | Germany | 92.1 /100 | #131 | Exceptional 17.0% |
| Whites/Caucasians | 92.1 /100 | #132 | Exceptional 17.0% |
| Immigrants | Jordan | 91.9 /100 | #133 | Exceptional 17.0% |
| Immigrants | Chile | 91.7 /100 | #134 | Exceptional 17.0% |
| Lebanese | 91.3 /100 | #135 | Exceptional 17.0% |
| Israelis | 91.0 /100 | #136 | Exceptional 17.0% |
| Immigrants | Norway | 90.9 /100 | #137 | Exceptional 17.0% |