Immigrants from Pakistan vs Sioux Disability
COMPARE
Immigrants from Pakistan
Sioux
Disability
Disability Comparison
Immigrants from Pakistan
Sioux
10.4%
DISABILITY
100.0/ 100
METRIC RATING
19th/ 347
METRIC RANK
12.8%
DISABILITY
0.0/ 100
METRIC RATING
275th/ 347
METRIC RANK
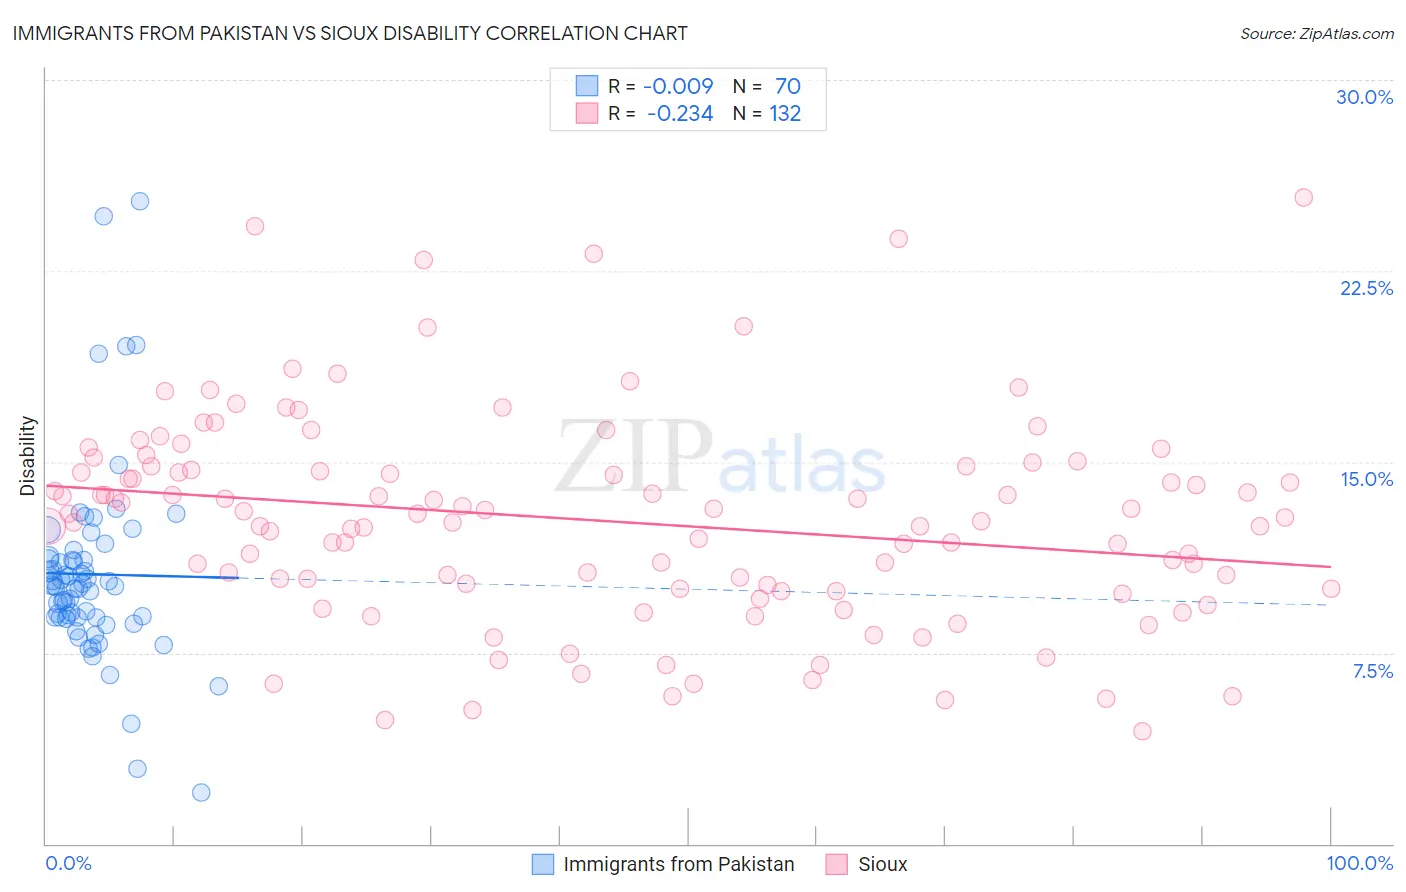
Immigrants from Pakistan vs Sioux Disability Correlation Chart
The statistical analysis conducted on geographies consisting of 283,903,019 people shows no correlation between the proportion of Immigrants from Pakistan and percentage of population with a disability in the United States with a correlation coefficient (R) of -0.009 and weighted average of 10.4%. Similarly, the statistical analysis conducted on geographies consisting of 234,155,753 people shows a weak negative correlation between the proportion of Sioux and percentage of population with a disability in the United States with a correlation coefficient (R) of -0.234 and weighted average of 12.8%, a difference of 23.2%.
Disability Correlation Summary
| Measurement | Immigrants from Pakistan | Sioux |
| Minimum | 2.0% | 4.4% |
| Maximum | 25.2% | 25.4% |
| Range | 23.2% | 21.0% |
| Mean | 10.6% | 12.7% |
| Median | 10.1% | 12.7% |
| Interquartile 25% (IQ1) | 8.9% | 10.0% |
| Interquartile 75% (IQ3) | 11.2% | 14.8% |
| Interquartile Range (IQR) | 2.3% | 4.7% |
| Standard Deviation (Sample) | 3.8% | 4.1% |
| Standard Deviation (Population) | 3.8% | 4.1% |
Similar Demographics by Disability
Demographics Similar to Immigrants from Pakistan by Disability
In terms of disability, the demographic groups most similar to Immigrants from Pakistan are Burmese (10.4%, a difference of 0.010%), Immigrants from Venezuela (10.4%, a difference of 0.69%), Asian (10.4%, a difference of 0.72%), Immigrants from Sri Lanka (10.5%, a difference of 0.82%), and Immigrants from Iran (10.3%, a difference of 0.99%).
| Demographics | Rating | Rank | Disability |
| Immigrants | Israel | 100.0 /100 | #12 | Exceptional 10.1% |
| Immigrants | Eastern Asia | 100.0 /100 | #13 | Exceptional 10.2% |
| Immigrants | Korea | 100.0 /100 | #14 | Exceptional 10.2% |
| Okinawans | 100.0 /100 | #15 | Exceptional 10.3% |
| Indians (Asian) | 100.0 /100 | #16 | Exceptional 10.3% |
| Immigrants | Iran | 100.0 /100 | #17 | Exceptional 10.3% |
| Burmese | 100.0 /100 | #18 | Exceptional 10.4% |
| Immigrants | Pakistan | 100.0 /100 | #19 | Exceptional 10.4% |
| Immigrants | Venezuela | 100.0 /100 | #20 | Exceptional 10.4% |
| Asians | 100.0 /100 | #21 | Exceptional 10.4% |
| Immigrants | Sri Lanka | 100.0 /100 | #22 | Exceptional 10.5% |
| Immigrants | Asia | 100.0 /100 | #23 | Exceptional 10.5% |
| Venezuelans | 100.0 /100 | #24 | Exceptional 10.5% |
| Immigrants | Malaysia | 100.0 /100 | #25 | Exceptional 10.6% |
| Argentineans | 100.0 /100 | #26 | Exceptional 10.6% |
Demographics Similar to Sioux by Disability
In terms of disability, the demographic groups most similar to Sioux are Nepalese (12.8%, a difference of 0.080%), Hmong (12.8%, a difference of 0.15%), Dutch (12.8%, a difference of 0.20%), German (12.8%, a difference of 0.37%), and Fijian (12.8%, a difference of 0.46%).
| Demographics | Rating | Rank | Disability |
| Bangladeshis | 0.1 /100 | #268 | Tragic 12.6% |
| Immigrants | Dominican Republic | 0.1 /100 | #269 | Tragic 12.6% |
| Portuguese | 0.1 /100 | #270 | Tragic 12.6% |
| Immigrants | Yemen | 0.1 /100 | #271 | Tragic 12.6% |
| Dominicans | 0.0 /100 | #272 | Tragic 12.7% |
| Finns | 0.0 /100 | #273 | Tragic 12.7% |
| Nepalese | 0.0 /100 | #274 | Tragic 12.8% |
| Sioux | 0.0 /100 | #275 | Tragic 12.8% |
| Hmong | 0.0 /100 | #276 | Tragic 12.8% |
| Dutch | 0.0 /100 | #277 | Tragic 12.8% |
| Germans | 0.0 /100 | #278 | Tragic 12.8% |
| Fijians | 0.0 /100 | #279 | Tragic 12.8% |
| Spanish | 0.0 /100 | #280 | Tragic 12.8% |
| Immigrants | Portugal | 0.0 /100 | #281 | Tragic 12.9% |
| Scottish | 0.0 /100 | #282 | Tragic 12.9% |