Soviet Union vs Sioux Disability
COMPARE
Soviet Union
Sioux
Disability
Disability Comparison
Soviet Union
Sioux
10.9%
DISABILITY
99.9/ 100
METRIC RATING
48th/ 347
METRIC RANK
12.8%
DISABILITY
0.0/ 100
METRIC RATING
275th/ 347
METRIC RANK
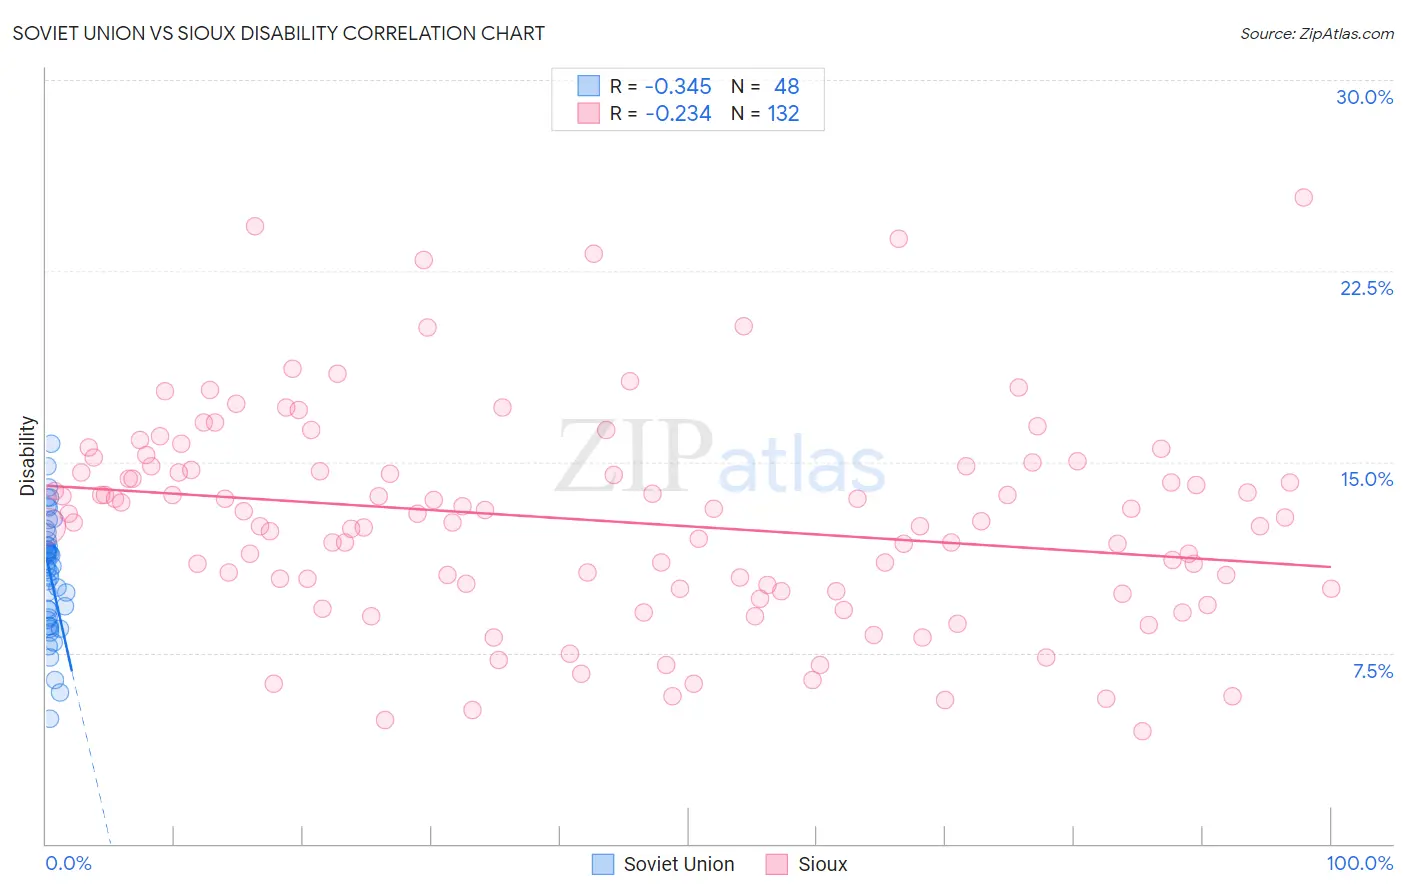
Soviet Union vs Sioux Disability Correlation Chart
The statistical analysis conducted on geographies consisting of 43,487,843 people shows a mild negative correlation between the proportion of Soviet Union and percentage of population with a disability in the United States with a correlation coefficient (R) of -0.345 and weighted average of 10.9%. Similarly, the statistical analysis conducted on geographies consisting of 234,155,753 people shows a weak negative correlation between the proportion of Sioux and percentage of population with a disability in the United States with a correlation coefficient (R) of -0.234 and weighted average of 12.8%, a difference of 17.8%.
Disability Correlation Summary
| Measurement | Soviet Union | Sioux |
| Minimum | 4.9% | 4.4% |
| Maximum | 15.7% | 25.4% |
| Range | 10.8% | 21.0% |
| Mean | 10.6% | 12.7% |
| Median | 10.9% | 12.7% |
| Interquartile 25% (IQ1) | 8.9% | 10.0% |
| Interquartile 75% (IQ3) | 11.8% | 14.8% |
| Interquartile Range (IQR) | 3.0% | 4.7% |
| Standard Deviation (Sample) | 2.3% | 4.1% |
| Standard Deviation (Population) | 2.3% | 4.1% |
Similar Demographics by Disability
Demographics Similar to Soviet Union by Disability
In terms of disability, the demographic groups most similar to Soviet Union are Vietnamese (10.9%, a difference of 0.060%), Immigrants from Saudi Arabia (10.9%, a difference of 0.060%), Peruvian (10.9%, a difference of 0.070%), South American (10.9%, a difference of 0.13%), and Immigrants from Spain (10.9%, a difference of 0.15%).
| Demographics | Rating | Rank | Disability |
| Immigrants | Australia | 99.9 /100 | #41 | Exceptional 10.8% |
| Immigrants | Nepal | 99.9 /100 | #42 | Exceptional 10.8% |
| Israelis | 99.9 /100 | #43 | Exceptional 10.8% |
| Immigrants | Japan | 99.9 /100 | #44 | Exceptional 10.8% |
| Immigrants | Peru | 99.9 /100 | #45 | Exceptional 10.8% |
| Tongans | 99.9 /100 | #46 | Exceptional 10.8% |
| Taiwanese | 99.9 /100 | #47 | Exceptional 10.8% |
| Soviet Union | 99.9 /100 | #48 | Exceptional 10.9% |
| Vietnamese | 99.9 /100 | #49 | Exceptional 10.9% |
| Immigrants | Saudi Arabia | 99.9 /100 | #50 | Exceptional 10.9% |
| Peruvians | 99.8 /100 | #51 | Exceptional 10.9% |
| South Americans | 99.8 /100 | #52 | Exceptional 10.9% |
| Immigrants | Spain | 99.8 /100 | #53 | Exceptional 10.9% |
| Jordanians | 99.8 /100 | #54 | Exceptional 10.9% |
| Immigrants | El Salvador | 99.8 /100 | #55 | Exceptional 10.9% |
Demographics Similar to Sioux by Disability
In terms of disability, the demographic groups most similar to Sioux are Nepalese (12.8%, a difference of 0.080%), Hmong (12.8%, a difference of 0.15%), Dutch (12.8%, a difference of 0.20%), German (12.8%, a difference of 0.37%), and Fijian (12.8%, a difference of 0.46%).
| Demographics | Rating | Rank | Disability |
| Bangladeshis | 0.1 /100 | #268 | Tragic 12.6% |
| Immigrants | Dominican Republic | 0.1 /100 | #269 | Tragic 12.6% |
| Portuguese | 0.1 /100 | #270 | Tragic 12.6% |
| Immigrants | Yemen | 0.1 /100 | #271 | Tragic 12.6% |
| Dominicans | 0.0 /100 | #272 | Tragic 12.7% |
| Finns | 0.0 /100 | #273 | Tragic 12.7% |
| Nepalese | 0.0 /100 | #274 | Tragic 12.8% |
| Sioux | 0.0 /100 | #275 | Tragic 12.8% |
| Hmong | 0.0 /100 | #276 | Tragic 12.8% |
| Dutch | 0.0 /100 | #277 | Tragic 12.8% |
| Germans | 0.0 /100 | #278 | Tragic 12.8% |
| Fijians | 0.0 /100 | #279 | Tragic 12.8% |
| Spanish | 0.0 /100 | #280 | Tragic 12.8% |
| Immigrants | Portugal | 0.0 /100 | #281 | Tragic 12.9% |
| Scottish | 0.0 /100 | #282 | Tragic 12.9% |