Pueblo vs Portuguese Cognitive Disability
COMPARE
Pueblo
Portuguese
Cognitive Disability
Cognitive Disability Comparison
Pueblo
Portuguese
18.7%
COGNITIVE DISABILITY
0.0/ 100
METRIC RATING
323rd/ 347
METRIC RANK
16.9%
COGNITIVE DISABILITY
94.7/ 100
METRIC RATING
123rd/ 347
METRIC RANK
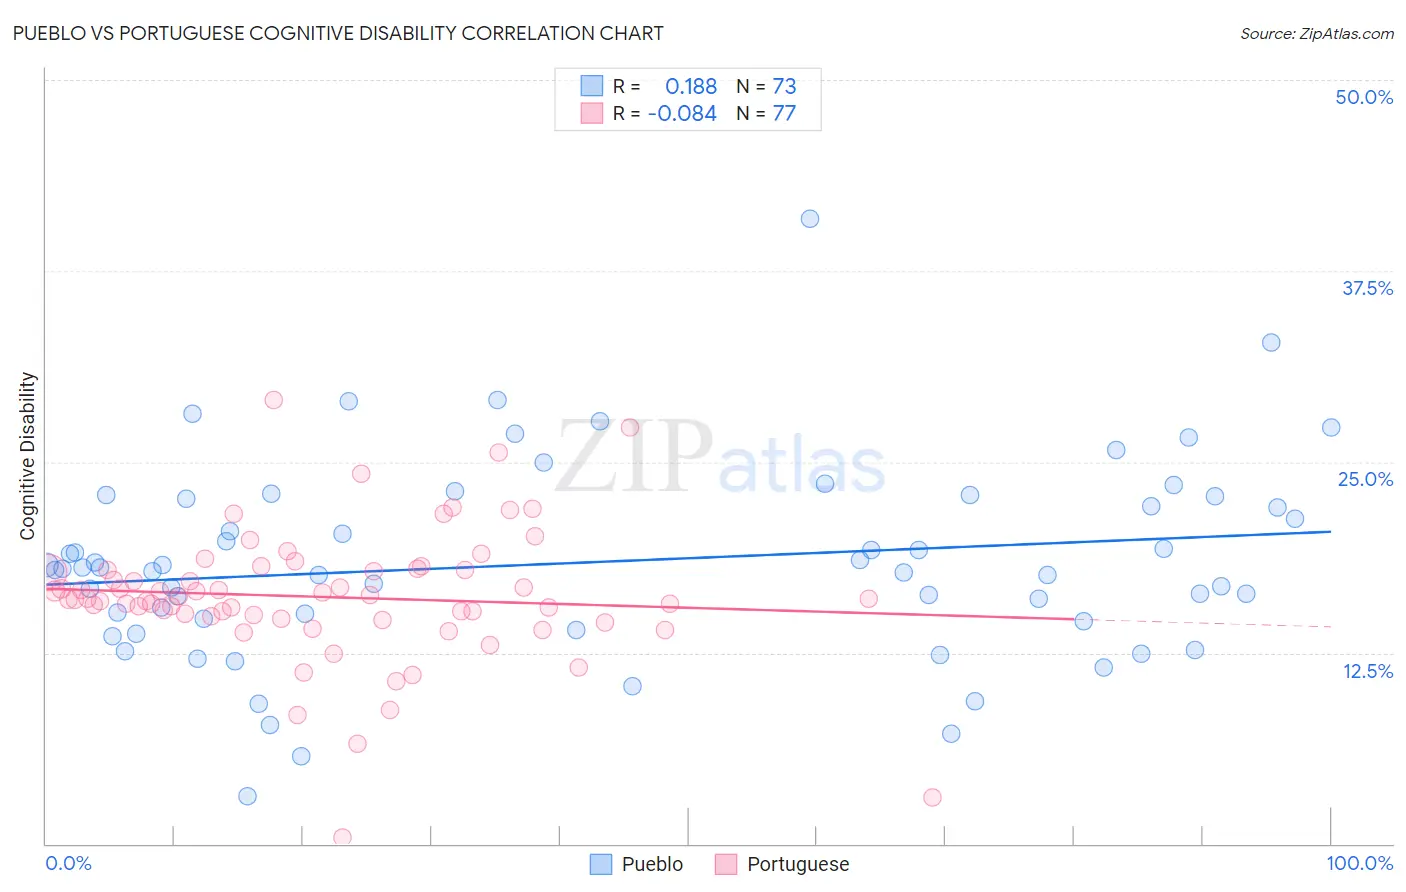
Pueblo vs Portuguese Cognitive Disability Correlation Chart
The statistical analysis conducted on geographies consisting of 120,078,702 people shows a poor positive correlation between the proportion of Pueblo and percentage of population with cognitive disability in the United States with a correlation coefficient (R) of 0.188 and weighted average of 18.7%. Similarly, the statistical analysis conducted on geographies consisting of 450,269,576 people shows a slight negative correlation between the proportion of Portuguese and percentage of population with cognitive disability in the United States with a correlation coefficient (R) of -0.084 and weighted average of 16.9%, a difference of 10.2%.
Cognitive Disability Correlation Summary
| Measurement | Pueblo | Portuguese |
| Minimum | 3.1% | 0.38% |
| Maximum | 40.9% | 29.1% |
| Range | 37.7% | 28.7% |
| Mean | 18.4% | 16.2% |
| Median | 18.0% | 16.0% |
| Interquartile 25% (IQ1) | 14.7% | 14.8% |
| Interquartile 75% (IQ3) | 22.7% | 17.9% |
| Interquartile Range (IQR) | 8.0% | 3.1% |
| Standard Deviation (Sample) | 6.4% | 4.4% |
| Standard Deviation (Population) | 6.3% | 4.4% |
Similar Demographics by Cognitive Disability
Demographics Similar to Pueblo by Cognitive Disability
In terms of cognitive disability, the demographic groups most similar to Pueblo are Immigrants from Liberia (18.7%, a difference of 0.020%), African (18.6%, a difference of 0.080%), Dominican (18.7%, a difference of 0.12%), Apache (18.6%, a difference of 0.17%), and Indonesian (18.7%, a difference of 0.20%).
| Demographics | Rating | Rank | Cognitive Disability |
| Immigrants | Middle Africa | 0.0 /100 | #316 | Tragic 18.6% |
| Liberians | 0.0 /100 | #317 | Tragic 18.6% |
| Bangladeshis | 0.0 /100 | #318 | Tragic 18.6% |
| Comanche | 0.0 /100 | #319 | Tragic 18.6% |
| Apache | 0.0 /100 | #320 | Tragic 18.6% |
| Africans | 0.0 /100 | #321 | Tragic 18.6% |
| Immigrants | Liberia | 0.0 /100 | #322 | Tragic 18.7% |
| Pueblo | 0.0 /100 | #323 | Tragic 18.7% |
| Dominicans | 0.0 /100 | #324 | Tragic 18.7% |
| Indonesians | 0.0 /100 | #325 | Tragic 18.7% |
| Immigrants | Senegal | 0.0 /100 | #326 | Tragic 18.7% |
| U.S. Virgin Islanders | 0.0 /100 | #327 | Tragic 18.7% |
| Kiowa | 0.0 /100 | #328 | Tragic 18.7% |
| Navajo | 0.0 /100 | #329 | Tragic 18.8% |
| Immigrants | Dominican Republic | 0.0 /100 | #330 | Tragic 18.8% |
Demographics Similar to Portuguese by Cognitive Disability
In terms of cognitive disability, the demographic groups most similar to Portuguese are Immigrants from Western Europe (16.9%, a difference of 0.010%), Turkish (16.9%, a difference of 0.020%), Immigrants from China (16.9%, a difference of 0.030%), Scottish (16.9%, a difference of 0.040%), and Scandinavian (16.9%, a difference of 0.080%).
| Demographics | Rating | Rank | Cognitive Disability |
| Inupiat | 96.5 /100 | #116 | Exceptional 16.9% |
| Immigrants | Japan | 96.2 /100 | #117 | Exceptional 16.9% |
| Immigrants | Denmark | 96.2 /100 | #118 | Exceptional 16.9% |
| South Africans | 95.5 /100 | #119 | Exceptional 16.9% |
| Scottish | 95.0 /100 | #120 | Exceptional 16.9% |
| Immigrants | China | 94.9 /100 | #121 | Exceptional 16.9% |
| Immigrants | Western Europe | 94.8 /100 | #122 | Exceptional 16.9% |
| Portuguese | 94.7 /100 | #123 | Exceptional 16.9% |
| Turks | 94.5 /100 | #124 | Exceptional 16.9% |
| Scandinavians | 94.1 /100 | #125 | Exceptional 16.9% |
| Europeans | 93.4 /100 | #126 | Exceptional 17.0% |
| Immigrants | Costa Rica | 93.1 /100 | #127 | Exceptional 17.0% |
| Nicaraguans | 93.0 /100 | #128 | Exceptional 17.0% |
| Immigrants | Uruguay | 92.9 /100 | #129 | Exceptional 17.0% |
| Immigrants | Vietnam | 92.4 /100 | #130 | Exceptional 17.0% |