Immigrants from Sudan vs Portuguese Cognitive Disability
COMPARE
Immigrants from Sudan
Portuguese
Cognitive Disability
Cognitive Disability Comparison
Immigrants from Sudan
Portuguese
18.8%
COGNITIVE DISABILITY
0.0/ 100
METRIC RATING
332nd/ 347
METRIC RANK
16.9%
COGNITIVE DISABILITY
94.7/ 100
METRIC RATING
123rd/ 347
METRIC RANK
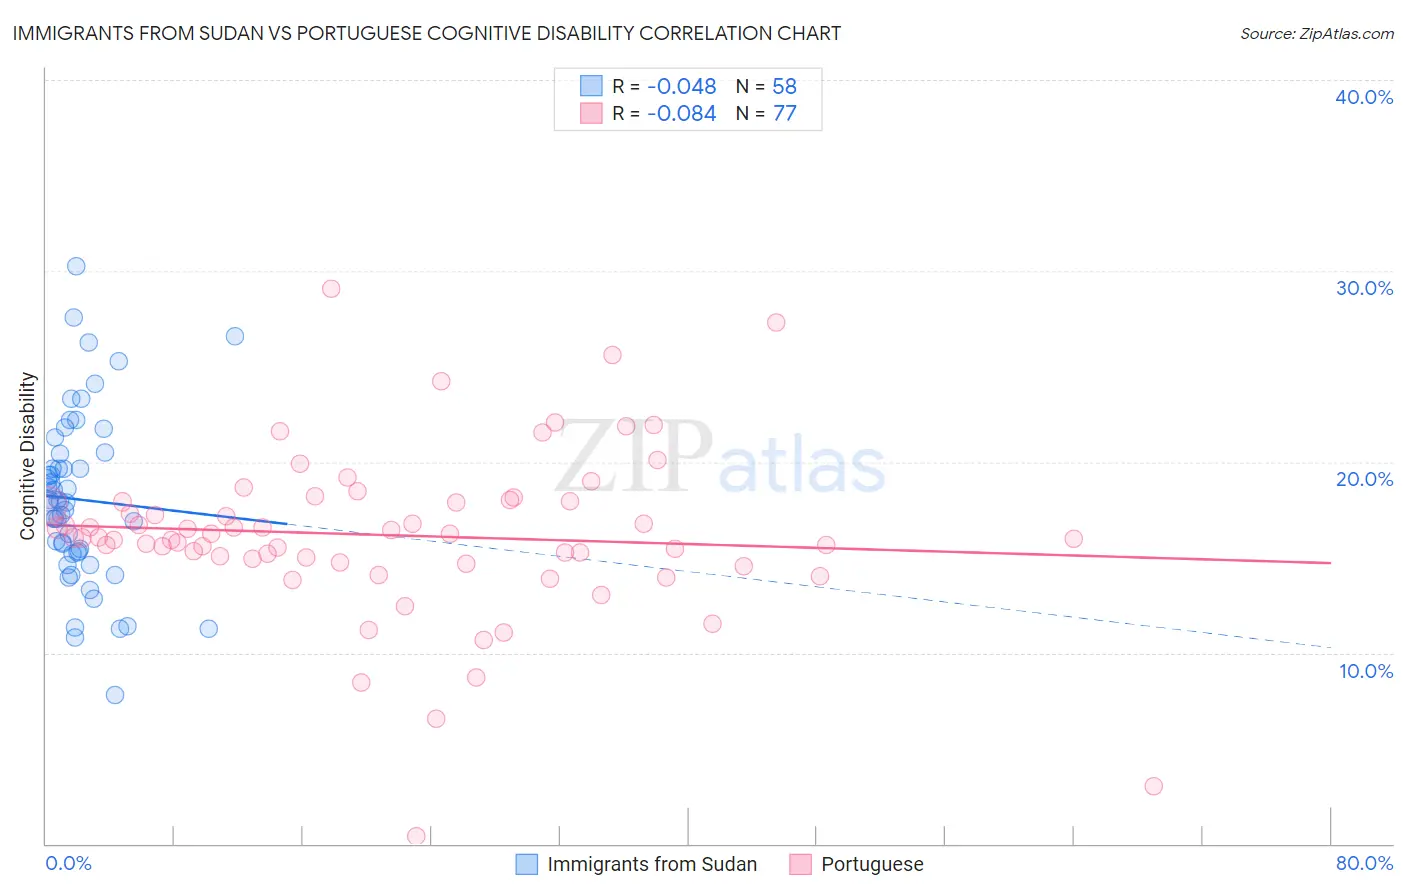
Immigrants from Sudan vs Portuguese Cognitive Disability Correlation Chart
The statistical analysis conducted on geographies consisting of 118,956,545 people shows no correlation between the proportion of Immigrants from Sudan and percentage of population with cognitive disability in the United States with a correlation coefficient (R) of -0.048 and weighted average of 18.8%. Similarly, the statistical analysis conducted on geographies consisting of 450,269,576 people shows a slight negative correlation between the proportion of Portuguese and percentage of population with cognitive disability in the United States with a correlation coefficient (R) of -0.084 and weighted average of 16.9%, a difference of 11.0%.
Cognitive Disability Correlation Summary
| Measurement | Immigrants from Sudan | Portuguese |
| Minimum | 7.8% | 0.38% |
| Maximum | 30.2% | 29.1% |
| Range | 22.4% | 28.7% |
| Mean | 18.0% | 16.2% |
| Median | 17.9% | 16.0% |
| Interquartile 25% (IQ1) | 15.3% | 14.8% |
| Interquartile 75% (IQ3) | 20.4% | 17.9% |
| Interquartile Range (IQR) | 5.1% | 3.1% |
| Standard Deviation (Sample) | 4.5% | 4.4% |
| Standard Deviation (Population) | 4.4% | 4.4% |
Similar Demographics by Cognitive Disability
Demographics Similar to Immigrants from Sudan by Cognitive Disability
In terms of cognitive disability, the demographic groups most similar to Immigrants from Sudan are Pima (18.8%, a difference of 0.020%), Immigrants from Yemen (18.8%, a difference of 0.060%), Immigrants from Dominican Republic (18.8%, a difference of 0.080%), Navajo (18.8%, a difference of 0.18%), and Kiowa (18.7%, a difference of 0.40%).
| Demographics | Rating | Rank | Cognitive Disability |
| Indonesians | 0.0 /100 | #325 | Tragic 18.7% |
| Immigrants | Senegal | 0.0 /100 | #326 | Tragic 18.7% |
| U.S. Virgin Islanders | 0.0 /100 | #327 | Tragic 18.7% |
| Kiowa | 0.0 /100 | #328 | Tragic 18.7% |
| Navajo | 0.0 /100 | #329 | Tragic 18.8% |
| Immigrants | Dominican Republic | 0.0 /100 | #330 | Tragic 18.8% |
| Pima | 0.0 /100 | #331 | Tragic 18.8% |
| Immigrants | Sudan | 0.0 /100 | #332 | Tragic 18.8% |
| Immigrants | Yemen | 0.0 /100 | #333 | Tragic 18.8% |
| Sudanese | 0.0 /100 | #334 | Tragic 18.9% |
| Senegalese | 0.0 /100 | #335 | Tragic 19.0% |
| Blacks/African Americans | 0.0 /100 | #336 | Tragic 19.0% |
| Immigrants | Saudi Arabia | 0.0 /100 | #337 | Tragic 19.1% |
| Lumbee | 0.0 /100 | #338 | Tragic 19.1% |
| Puerto Ricans | 0.0 /100 | #339 | Tragic 19.2% |
Demographics Similar to Portuguese by Cognitive Disability
In terms of cognitive disability, the demographic groups most similar to Portuguese are Immigrants from Western Europe (16.9%, a difference of 0.010%), Turkish (16.9%, a difference of 0.020%), Immigrants from China (16.9%, a difference of 0.030%), Scottish (16.9%, a difference of 0.040%), and Scandinavian (16.9%, a difference of 0.080%).
| Demographics | Rating | Rank | Cognitive Disability |
| Inupiat | 96.5 /100 | #116 | Exceptional 16.9% |
| Immigrants | Japan | 96.2 /100 | #117 | Exceptional 16.9% |
| Immigrants | Denmark | 96.2 /100 | #118 | Exceptional 16.9% |
| South Africans | 95.5 /100 | #119 | Exceptional 16.9% |
| Scottish | 95.0 /100 | #120 | Exceptional 16.9% |
| Immigrants | China | 94.9 /100 | #121 | Exceptional 16.9% |
| Immigrants | Western Europe | 94.8 /100 | #122 | Exceptional 16.9% |
| Portuguese | 94.7 /100 | #123 | Exceptional 16.9% |
| Turks | 94.5 /100 | #124 | Exceptional 16.9% |
| Scandinavians | 94.1 /100 | #125 | Exceptional 16.9% |
| Europeans | 93.4 /100 | #126 | Exceptional 17.0% |
| Immigrants | Costa Rica | 93.1 /100 | #127 | Exceptional 17.0% |
| Nicaraguans | 93.0 /100 | #128 | Exceptional 17.0% |
| Immigrants | Uruguay | 92.9 /100 | #129 | Exceptional 17.0% |
| Immigrants | Vietnam | 92.4 /100 | #130 | Exceptional 17.0% |