White/Caucasian vs Portuguese Unemployment Among Ages 35 to 44 years
COMPARE
White/Caucasian
Portuguese
Unemployment Among Ages 35 to 44 years
Unemployment Among Ages 35 to 44 years Comparison
Whites/Caucasians
Portuguese
4.6%
UNEMPLOYMENT AMONG AGES 35 TO 44 YEARS
64.9/ 100
METRIC RATING
155th/ 347
METRIC RANK
5.1%
UNEMPLOYMENT AMONG AGES 35 TO 44 YEARS
1.1/ 100
METRIC RATING
234th/ 347
METRIC RANK
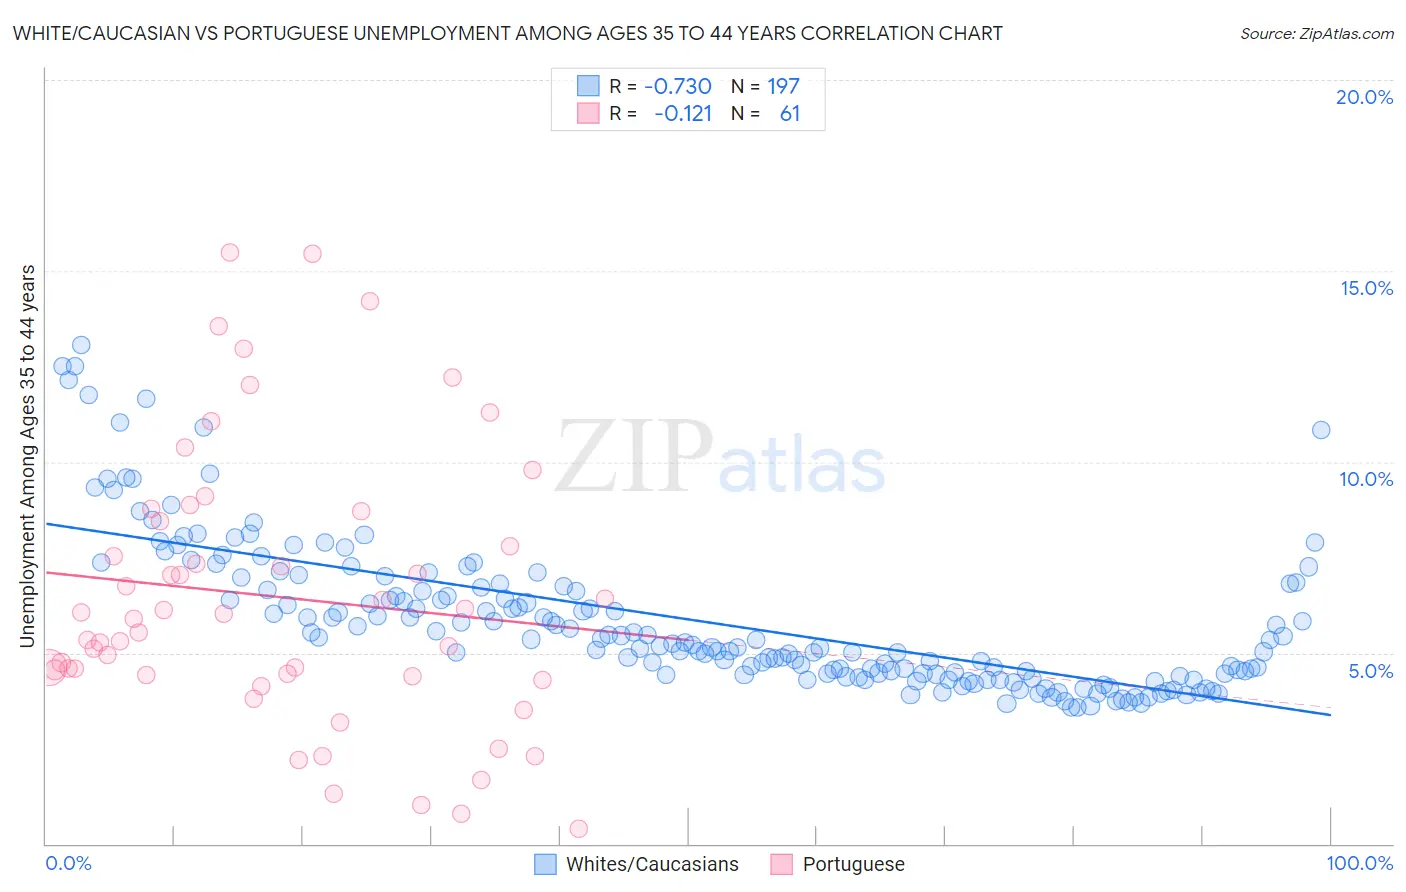
White/Caucasian vs Portuguese Unemployment Among Ages 35 to 44 years Correlation Chart
The statistical analysis conducted on geographies consisting of 539,752,608 people shows a strong negative correlation between the proportion of Whites/Caucasians and unemployment rate among population between the ages 35 and 44 in the United States with a correlation coefficient (R) of -0.730 and weighted average of 4.6%. Similarly, the statistical analysis conducted on geographies consisting of 435,170,607 people shows a poor negative correlation between the proportion of Portuguese and unemployment rate among population between the ages 35 and 44 in the United States with a correlation coefficient (R) of -0.121 and weighted average of 5.1%, a difference of 9.1%.
Unemployment Among Ages 35 to 44 years Correlation Summary
| Measurement | White/Caucasian | Portuguese |
| Minimum | 3.6% | 0.40% |
| Maximum | 13.1% | 15.5% |
| Range | 9.5% | 15.1% |
| Mean | 5.9% | 6.5% |
| Median | 5.3% | 5.9% |
| Interquartile 25% (IQ1) | 4.4% | 4.4% |
| Interquartile 75% (IQ3) | 6.8% | 8.6% |
| Interquartile Range (IQR) | 2.3% | 4.2% |
| Standard Deviation (Sample) | 2.0% | 3.6% |
| Standard Deviation (Population) | 2.0% | 3.6% |
Similar Demographics by Unemployment Among Ages 35 to 44 years
Demographics Similar to Whites/Caucasians by Unemployment Among Ages 35 to 44 years
In terms of unemployment among ages 35 to 44 years, the demographic groups most similar to Whites/Caucasians are Immigrants from Western Europe (4.6%, a difference of 0.050%), South American (4.6%, a difference of 0.090%), Immigrants from Belarus (4.6%, a difference of 0.11%), Immigrants from Iran (4.6%, a difference of 0.14%), and Albanian (4.6%, a difference of 0.15%).
| Demographics | Rating | Rank | Unemployment Among Ages 35 to 44 years |
| Slavs | 72.4 /100 | #148 | Good 4.6% |
| Immigrants | Burma/Myanmar | 72.2 /100 | #149 | Good 4.6% |
| Immigrants | England | 70.5 /100 | #150 | Good 4.6% |
| Puget Sound Salish | 67.1 /100 | #151 | Good 4.6% |
| Pakistanis | 67.1 /100 | #152 | Good 4.6% |
| Immigrants | Brazil | 67.0 /100 | #153 | Good 4.6% |
| Immigrants | Western Europe | 65.5 /100 | #154 | Good 4.6% |
| Whites/Caucasians | 64.9 /100 | #155 | Good 4.6% |
| South Americans | 63.7 /100 | #156 | Good 4.6% |
| Immigrants | Belarus | 63.4 /100 | #157 | Good 4.6% |
| Immigrants | Iran | 63.1 /100 | #158 | Good 4.6% |
| Albanians | 63.0 /100 | #159 | Good 4.6% |
| Hungarians | 62.6 /100 | #160 | Good 4.6% |
| Celtics | 61.7 /100 | #161 | Good 4.7% |
| Costa Ricans | 59.6 /100 | #162 | Average 4.7% |
Demographics Similar to Portuguese by Unemployment Among Ages 35 to 44 years
In terms of unemployment among ages 35 to 44 years, the demographic groups most similar to Portuguese are Immigrants from Nigeria (5.1%, a difference of 0.060%), Iroquois (5.1%, a difference of 0.11%), Japanese (5.1%, a difference of 0.19%), Liberian (5.1%, a difference of 0.22%), and Guamanian/Chamorro (5.1%, a difference of 0.26%).
| Demographics | Rating | Rank | Unemployment Among Ages 35 to 44 years |
| Immigrants | Uzbekistan | 1.9 /100 | #227 | Tragic 5.0% |
| Samoans | 1.8 /100 | #228 | Tragic 5.0% |
| Immigrants | Cambodia | 1.5 /100 | #229 | Tragic 5.0% |
| Liberians | 1.3 /100 | #230 | Tragic 5.1% |
| Japanese | 1.2 /100 | #231 | Tragic 5.1% |
| Iroquois | 1.2 /100 | #232 | Tragic 5.1% |
| Immigrants | Nigeria | 1.2 /100 | #233 | Tragic 5.1% |
| Portuguese | 1.1 /100 | #234 | Tragic 5.1% |
| Guamanians/Chamorros | 0.9 /100 | #235 | Tragic 5.1% |
| Central Americans | 0.8 /100 | #236 | Tragic 5.1% |
| Kiowa | 0.8 /100 | #237 | Tragic 5.1% |
| Hondurans | 0.7 /100 | #238 | Tragic 5.1% |
| Nigerians | 0.7 /100 | #239 | Tragic 5.1% |
| Somalis | 0.7 /100 | #240 | Tragic 5.1% |
| Immigrants | Honduras | 0.6 /100 | #241 | Tragic 5.1% |