White/Caucasian vs Macedonian Disability Age 65 to 74
COMPARE
White/Caucasian
Macedonian
Disability Age 65 to 74
Disability Age 65 to 74 Comparison
Whites/Caucasians
Macedonians
24.2%
DISABILITY AGE 65 TO 74
6.6/ 100
METRIC RATING
228th/ 347
METRIC RANK
21.3%
DISABILITY AGE 65 TO 74
99.7/ 100
METRIC RATING
42nd/ 347
METRIC RANK
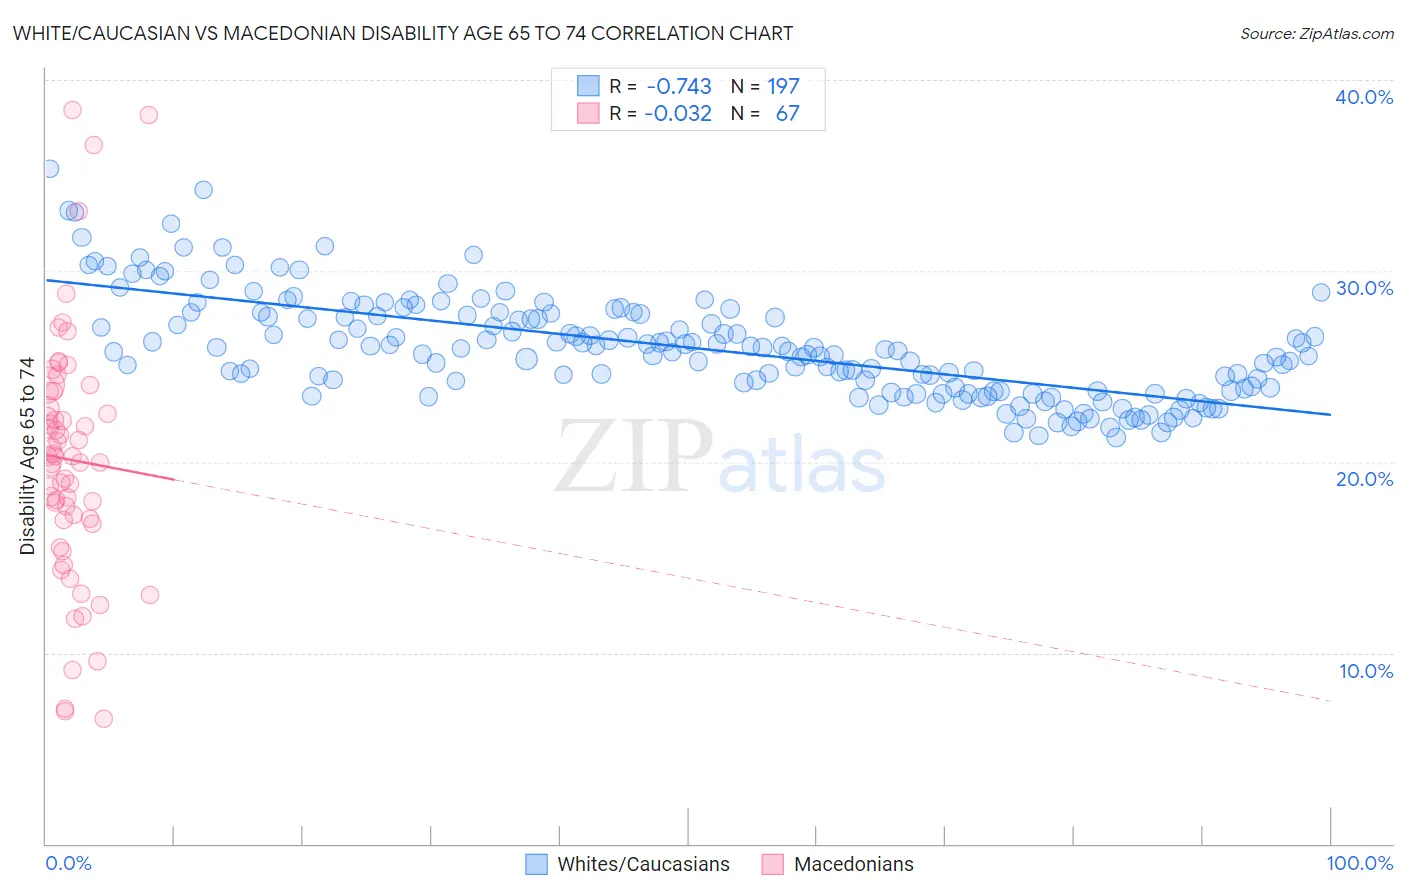
White/Caucasian vs Macedonian Disability Age 65 to 74 Correlation Chart
The statistical analysis conducted on geographies consisting of 580,018,355 people shows a strong negative correlation between the proportion of Whites/Caucasians and percentage of population with a disability between the ages 65 and 75 in the United States with a correlation coefficient (R) of -0.743 and weighted average of 24.2%. Similarly, the statistical analysis conducted on geographies consisting of 132,559,709 people shows no correlation between the proportion of Macedonians and percentage of population with a disability between the ages 65 and 75 in the United States with a correlation coefficient (R) of -0.032 and weighted average of 21.3%, a difference of 13.6%.
Disability Age 65 to 74 Correlation Summary
| Measurement | White/Caucasian | Macedonian |
| Minimum | 21.3% | 6.6% |
| Maximum | 35.4% | 38.4% |
| Range | 14.1% | 31.8% |
| Mean | 26.0% | 20.1% |
| Median | 25.8% | 20.3% |
| Interquartile 25% (IQ1) | 23.7% | 17.0% |
| Interquartile 75% (IQ3) | 27.7% | 23.7% |
| Interquartile Range (IQR) | 4.0% | 6.7% |
| Standard Deviation (Sample) | 2.7% | 6.5% |
| Standard Deviation (Population) | 2.7% | 6.5% |
Similar Demographics by Disability Age 65 to 74
Demographics Similar to Whites/Caucasians by Disability Age 65 to 74
In terms of disability age 65 to 74, the demographic groups most similar to Whites/Caucasians are Celtic (24.2%, a difference of 0.050%), Barbadian (24.3%, a difference of 0.16%), Nigerian (24.2%, a difference of 0.25%), Iraqi (24.2%, a difference of 0.31%), and Bermudan (24.2%, a difference of 0.32%).
| Demographics | Rating | Rank | Disability Age 65 to 74 |
| Immigrants | Nicaragua | 9.8 /100 | #221 | Tragic 24.1% |
| Native Hawaiians | 9.3 /100 | #222 | Tragic 24.1% |
| Immigrants | Middle Africa | 8.9 /100 | #223 | Tragic 24.1% |
| Immigrants | Panama | 8.6 /100 | #224 | Tragic 24.1% |
| Bermudans | 8.2 /100 | #225 | Tragic 24.2% |
| Iraqis | 8.1 /100 | #226 | Tragic 24.2% |
| Nigerians | 7.8 /100 | #227 | Tragic 24.2% |
| Whites/Caucasians | 6.6 /100 | #228 | Tragic 24.2% |
| Celtics | 6.4 /100 | #229 | Tragic 24.2% |
| Barbadians | 6.0 /100 | #230 | Tragic 24.3% |
| Immigrants | Thailand | 5.2 /100 | #231 | Tragic 24.3% |
| Immigrants | Zaire | 5.0 /100 | #232 | Tragic 24.3% |
| Bahamians | 4.5 /100 | #233 | Tragic 24.4% |
| Panamanians | 4.2 /100 | #234 | Tragic 24.4% |
| Scotch-Irish | 3.8 /100 | #235 | Tragic 24.4% |
Demographics Similar to Macedonians by Disability Age 65 to 74
In terms of disability age 65 to 74, the demographic groups most similar to Macedonians are Immigrants from Croatia (21.3%, a difference of 0.020%), Estonian (21.4%, a difference of 0.15%), Asian (21.4%, a difference of 0.17%), Immigrants from Turkey (21.4%, a difference of 0.20%), and Immigrants from Bulgaria (21.4%, a difference of 0.20%).
| Demographics | Rating | Rank | Disability Age 65 to 74 |
| Bulgarians | 99.9 /100 | #35 | Exceptional 21.1% |
| Immigrants | Switzerland | 99.8 /100 | #36 | Exceptional 21.1% |
| Israelis | 99.8 /100 | #37 | Exceptional 21.2% |
| Russians | 99.8 /100 | #38 | Exceptional 21.2% |
| Argentineans | 99.8 /100 | #39 | Exceptional 21.2% |
| Latvians | 99.8 /100 | #40 | Exceptional 21.2% |
| Immigrants | Austria | 99.8 /100 | #41 | Exceptional 21.2% |
| Macedonians | 99.7 /100 | #42 | Exceptional 21.3% |
| Immigrants | Croatia | 99.7 /100 | #43 | Exceptional 21.3% |
| Estonians | 99.7 /100 | #44 | Exceptional 21.4% |
| Asians | 99.7 /100 | #45 | Exceptional 21.4% |
| Immigrants | Turkey | 99.7 /100 | #46 | Exceptional 21.4% |
| Immigrants | Bulgaria | 99.7 /100 | #47 | Exceptional 21.4% |
| Lithuanians | 99.7 /100 | #48 | Exceptional 21.4% |
| Luxembourgers | 99.7 /100 | #49 | Exceptional 21.4% |