White/Caucasian vs Jordanian Disability Age 65 to 74
COMPARE
White/Caucasian
Jordanian
Disability Age 65 to 74
Disability Age 65 to 74 Comparison
Whites/Caucasians
Jordanians
24.2%
DISABILITY AGE 65 TO 74
6.6/ 100
METRIC RATING
228th/ 347
METRIC RANK
22.2%
DISABILITY AGE 65 TO 74
96.9/ 100
METRIC RATING
98th/ 347
METRIC RANK
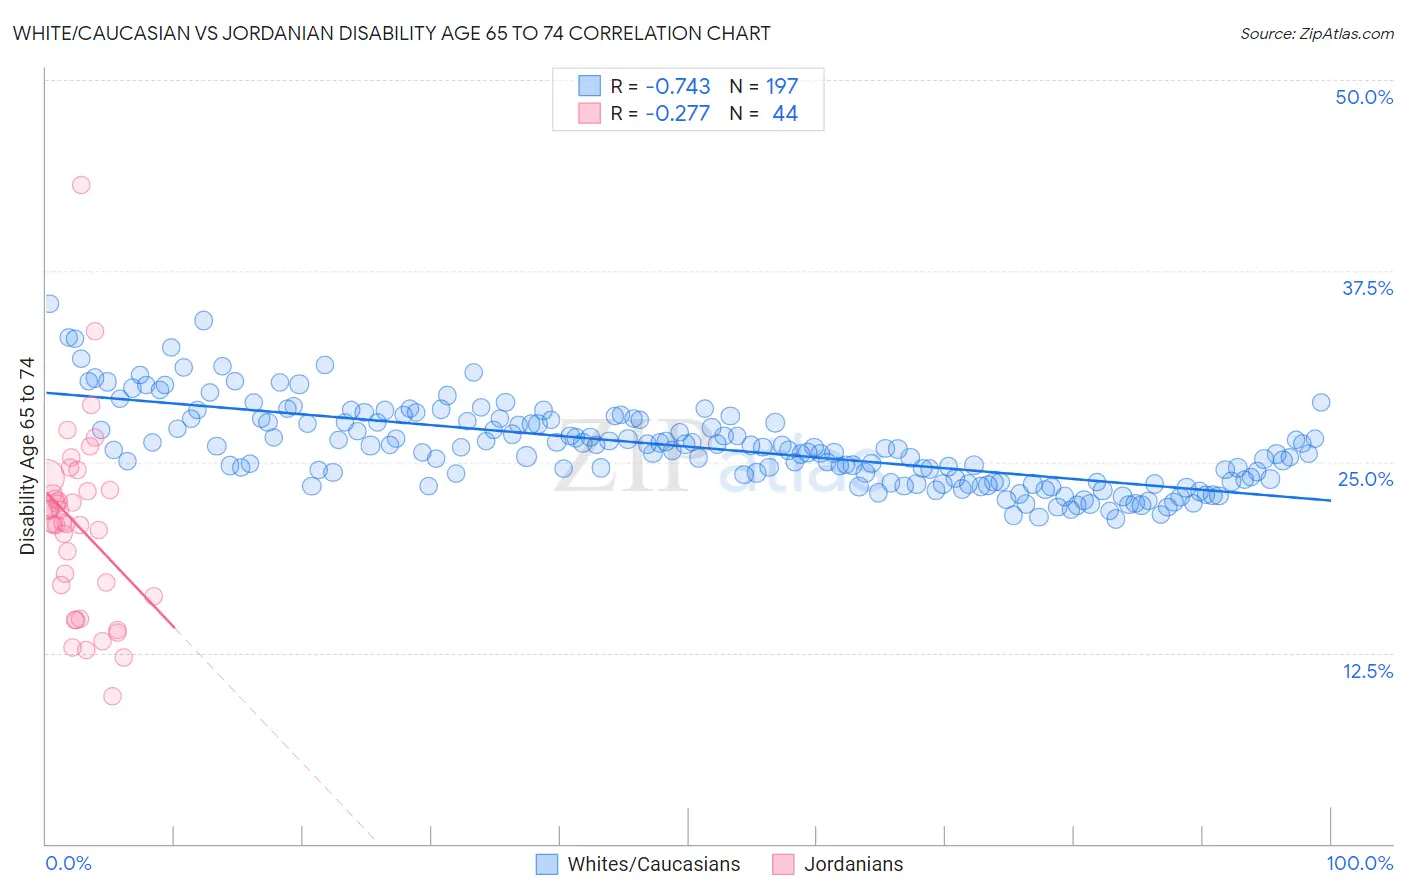
White/Caucasian vs Jordanian Disability Age 65 to 74 Correlation Chart
The statistical analysis conducted on geographies consisting of 580,018,355 people shows a strong negative correlation between the proportion of Whites/Caucasians and percentage of population with a disability between the ages 65 and 75 in the United States with a correlation coefficient (R) of -0.743 and weighted average of 24.2%. Similarly, the statistical analysis conducted on geographies consisting of 166,340,353 people shows a weak negative correlation between the proportion of Jordanians and percentage of population with a disability between the ages 65 and 75 in the United States with a correlation coefficient (R) of -0.277 and weighted average of 22.2%, a difference of 9.3%.
Disability Age 65 to 74 Correlation Summary
| Measurement | White/Caucasian | Jordanian |
| Minimum | 21.3% | 9.7% |
| Maximum | 35.4% | 43.1% |
| Range | 14.1% | 33.4% |
| Mean | 26.0% | 20.8% |
| Median | 25.8% | 21.0% |
| Interquartile 25% (IQ1) | 23.7% | 16.6% |
| Interquartile 75% (IQ3) | 27.7% | 23.1% |
| Interquartile Range (IQR) | 4.0% | 6.5% |
| Standard Deviation (Sample) | 2.7% | 6.0% |
| Standard Deviation (Population) | 2.7% | 6.0% |
Similar Demographics by Disability Age 65 to 74
Demographics Similar to Whites/Caucasians by Disability Age 65 to 74
In terms of disability age 65 to 74, the demographic groups most similar to Whites/Caucasians are Celtic (24.2%, a difference of 0.050%), Barbadian (24.3%, a difference of 0.16%), Nigerian (24.2%, a difference of 0.25%), Iraqi (24.2%, a difference of 0.31%), and Bermudan (24.2%, a difference of 0.32%).
| Demographics | Rating | Rank | Disability Age 65 to 74 |
| Immigrants | Nicaragua | 9.8 /100 | #221 | Tragic 24.1% |
| Native Hawaiians | 9.3 /100 | #222 | Tragic 24.1% |
| Immigrants | Middle Africa | 8.9 /100 | #223 | Tragic 24.1% |
| Immigrants | Panama | 8.6 /100 | #224 | Tragic 24.1% |
| Bermudans | 8.2 /100 | #225 | Tragic 24.2% |
| Iraqis | 8.1 /100 | #226 | Tragic 24.2% |
| Nigerians | 7.8 /100 | #227 | Tragic 24.2% |
| Whites/Caucasians | 6.6 /100 | #228 | Tragic 24.2% |
| Celtics | 6.4 /100 | #229 | Tragic 24.2% |
| Barbadians | 6.0 /100 | #230 | Tragic 24.3% |
| Immigrants | Thailand | 5.2 /100 | #231 | Tragic 24.3% |
| Immigrants | Zaire | 5.0 /100 | #232 | Tragic 24.3% |
| Bahamians | 4.5 /100 | #233 | Tragic 24.4% |
| Panamanians | 4.2 /100 | #234 | Tragic 24.4% |
| Scotch-Irish | 3.8 /100 | #235 | Tragic 24.4% |
Demographics Similar to Jordanians by Disability Age 65 to 74
In terms of disability age 65 to 74, the demographic groups most similar to Jordanians are Immigrants from Colombia (22.2%, a difference of 0.030%), Uruguayan (22.2%, a difference of 0.16%), Immigrants from England (22.2%, a difference of 0.17%), Immigrants from Saudi Arabia (22.2%, a difference of 0.20%), and Immigrants from Southern Europe (22.1%, a difference of 0.21%).
| Demographics | Rating | Rank | Disability Age 65 to 74 |
| Chileans | 97.9 /100 | #91 | Exceptional 22.0% |
| Poles | 97.8 /100 | #92 | Exceptional 22.0% |
| Immigrants | Canada | 97.8 /100 | #93 | Exceptional 22.1% |
| Immigrants | Chile | 97.7 /100 | #94 | Exceptional 22.1% |
| Romanians | 97.7 /100 | #95 | Exceptional 22.1% |
| Immigrants | North America | 97.5 /100 | #96 | Exceptional 22.1% |
| Immigrants | Southern Europe | 97.2 /100 | #97 | Exceptional 22.1% |
| Jordanians | 96.9 /100 | #98 | Exceptional 22.2% |
| Immigrants | Colombia | 96.8 /100 | #99 | Exceptional 22.2% |
| Uruguayans | 96.5 /100 | #100 | Exceptional 22.2% |
| Immigrants | England | 96.5 /100 | #101 | Exceptional 22.2% |
| Immigrants | Saudi Arabia | 96.4 /100 | #102 | Exceptional 22.2% |
| South Americans | 96.4 /100 | #103 | Exceptional 22.2% |
| Colombians | 96.4 /100 | #104 | Exceptional 22.2% |
| Palestinians | 96.3 /100 | #105 | Exceptional 22.2% |