White/Caucasian vs Bangladeshi Disability Age 65 to 74
COMPARE
White/Caucasian
Bangladeshi
Disability Age 65 to 74
Disability Age 65 to 74 Comparison
Whites/Caucasians
Bangladeshis
24.2%
DISABILITY AGE 65 TO 74
6.6/ 100
METRIC RATING
228th/ 347
METRIC RANK
26.8%
DISABILITY AGE 65 TO 74
0.0/ 100
METRIC RATING
296th/ 347
METRIC RANK
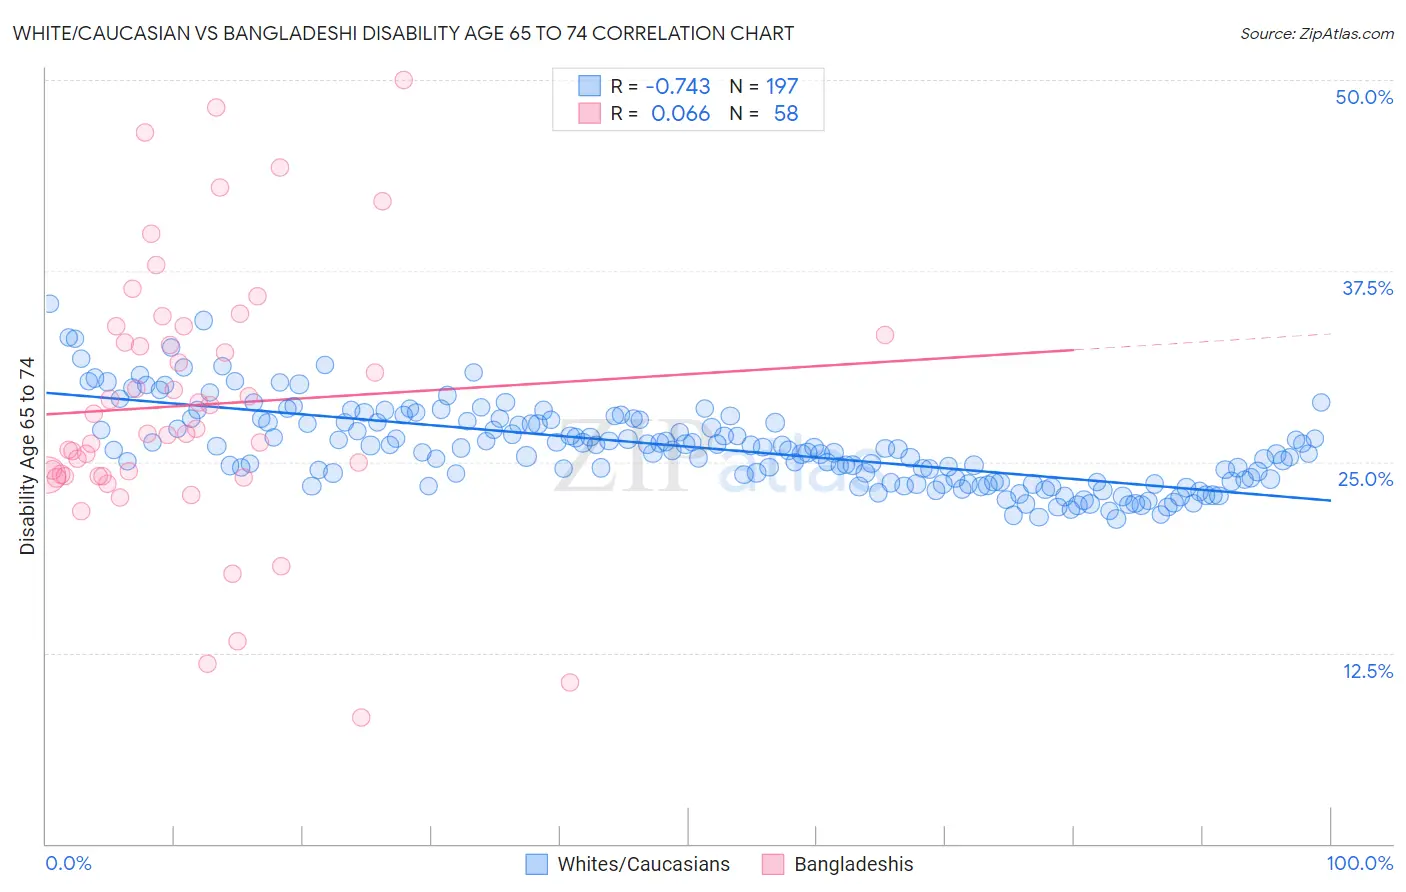
White/Caucasian vs Bangladeshi Disability Age 65 to 74 Correlation Chart
The statistical analysis conducted on geographies consisting of 580,018,355 people shows a strong negative correlation between the proportion of Whites/Caucasians and percentage of population with a disability between the ages 65 and 75 in the United States with a correlation coefficient (R) of -0.743 and weighted average of 24.2%. Similarly, the statistical analysis conducted on geographies consisting of 141,045,200 people shows a slight positive correlation between the proportion of Bangladeshis and percentage of population with a disability between the ages 65 and 75 in the United States with a correlation coefficient (R) of 0.066 and weighted average of 26.8%, a difference of 10.7%.
Disability Age 65 to 74 Correlation Summary
| Measurement | White/Caucasian | Bangladeshi |
| Minimum | 21.3% | 8.3% |
| Maximum | 35.4% | 50.0% |
| Range | 14.1% | 41.7% |
| Mean | 26.0% | 28.7% |
| Median | 25.8% | 27.0% |
| Interquartile 25% (IQ1) | 23.7% | 24.1% |
| Interquartile 75% (IQ3) | 27.7% | 33.3% |
| Interquartile Range (IQR) | 4.0% | 9.2% |
| Standard Deviation (Sample) | 2.7% | 8.6% |
| Standard Deviation (Population) | 2.7% | 8.5% |
Similar Demographics by Disability Age 65 to 74
Demographics Similar to Whites/Caucasians by Disability Age 65 to 74
In terms of disability age 65 to 74, the demographic groups most similar to Whites/Caucasians are Celtic (24.2%, a difference of 0.050%), Barbadian (24.3%, a difference of 0.16%), Nigerian (24.2%, a difference of 0.25%), Iraqi (24.2%, a difference of 0.31%), and Bermudan (24.2%, a difference of 0.32%).
| Demographics | Rating | Rank | Disability Age 65 to 74 |
| Immigrants | Nicaragua | 9.8 /100 | #221 | Tragic 24.1% |
| Native Hawaiians | 9.3 /100 | #222 | Tragic 24.1% |
| Immigrants | Middle Africa | 8.9 /100 | #223 | Tragic 24.1% |
| Immigrants | Panama | 8.6 /100 | #224 | Tragic 24.1% |
| Bermudans | 8.2 /100 | #225 | Tragic 24.2% |
| Iraqis | 8.1 /100 | #226 | Tragic 24.2% |
| Nigerians | 7.8 /100 | #227 | Tragic 24.2% |
| Whites/Caucasians | 6.6 /100 | #228 | Tragic 24.2% |
| Celtics | 6.4 /100 | #229 | Tragic 24.2% |
| Barbadians | 6.0 /100 | #230 | Tragic 24.3% |
| Immigrants | Thailand | 5.2 /100 | #231 | Tragic 24.3% |
| Immigrants | Zaire | 5.0 /100 | #232 | Tragic 24.3% |
| Bahamians | 4.5 /100 | #233 | Tragic 24.4% |
| Panamanians | 4.2 /100 | #234 | Tragic 24.4% |
| Scotch-Irish | 3.8 /100 | #235 | Tragic 24.4% |
Demographics Similar to Bangladeshis by Disability Age 65 to 74
In terms of disability age 65 to 74, the demographic groups most similar to Bangladeshis are Fijian (27.0%, a difference of 0.59%), Hispanic or Latino (26.7%, a difference of 0.61%), Immigrants from Yemen (27.0%, a difference of 0.61%), Dominican (26.7%, a difference of 0.63%), and Potawatomi (27.0%, a difference of 0.64%).
| Demographics | Rating | Rank | Disability Age 65 to 74 |
| Africans | 0.0 /100 | #289 | Tragic 26.2% |
| Immigrants | Cabo Verde | 0.0 /100 | #290 | Tragic 26.3% |
| Spanish American Indians | 0.0 /100 | #291 | Tragic 26.4% |
| Blackfeet | 0.0 /100 | #292 | Tragic 26.6% |
| Immigrants | Central America | 0.0 /100 | #293 | Tragic 26.6% |
| Dominicans | 0.0 /100 | #294 | Tragic 26.7% |
| Hispanics or Latinos | 0.0 /100 | #295 | Tragic 26.7% |
| Bangladeshis | 0.0 /100 | #296 | Tragic 26.8% |
| Fijians | 0.0 /100 | #297 | Tragic 27.0% |
| Immigrants | Yemen | 0.0 /100 | #298 | Tragic 27.0% |
| Potawatomi | 0.0 /100 | #299 | Tragic 27.0% |
| Immigrants | Dominican Republic | 0.0 /100 | #300 | Tragic 27.0% |
| Immigrants | Mexico | 0.0 /100 | #301 | Tragic 27.1% |
| Central American Indians | 0.0 /100 | #302 | Tragic 27.1% |
| Tlingit-Haida | 0.0 /100 | #303 | Tragic 27.1% |