Immigrants from Iran vs Macedonian Disability Age 65 to 74
COMPARE
Immigrants from Iran
Macedonian
Disability Age 65 to 74
Disability Age 65 to 74 Comparison
Immigrants from Iran
Macedonians
20.9%
DISABILITY AGE 65 TO 74
99.9/ 100
METRIC RATING
22nd/ 347
METRIC RANK
21.3%
DISABILITY AGE 65 TO 74
99.7/ 100
METRIC RATING
42nd/ 347
METRIC RANK
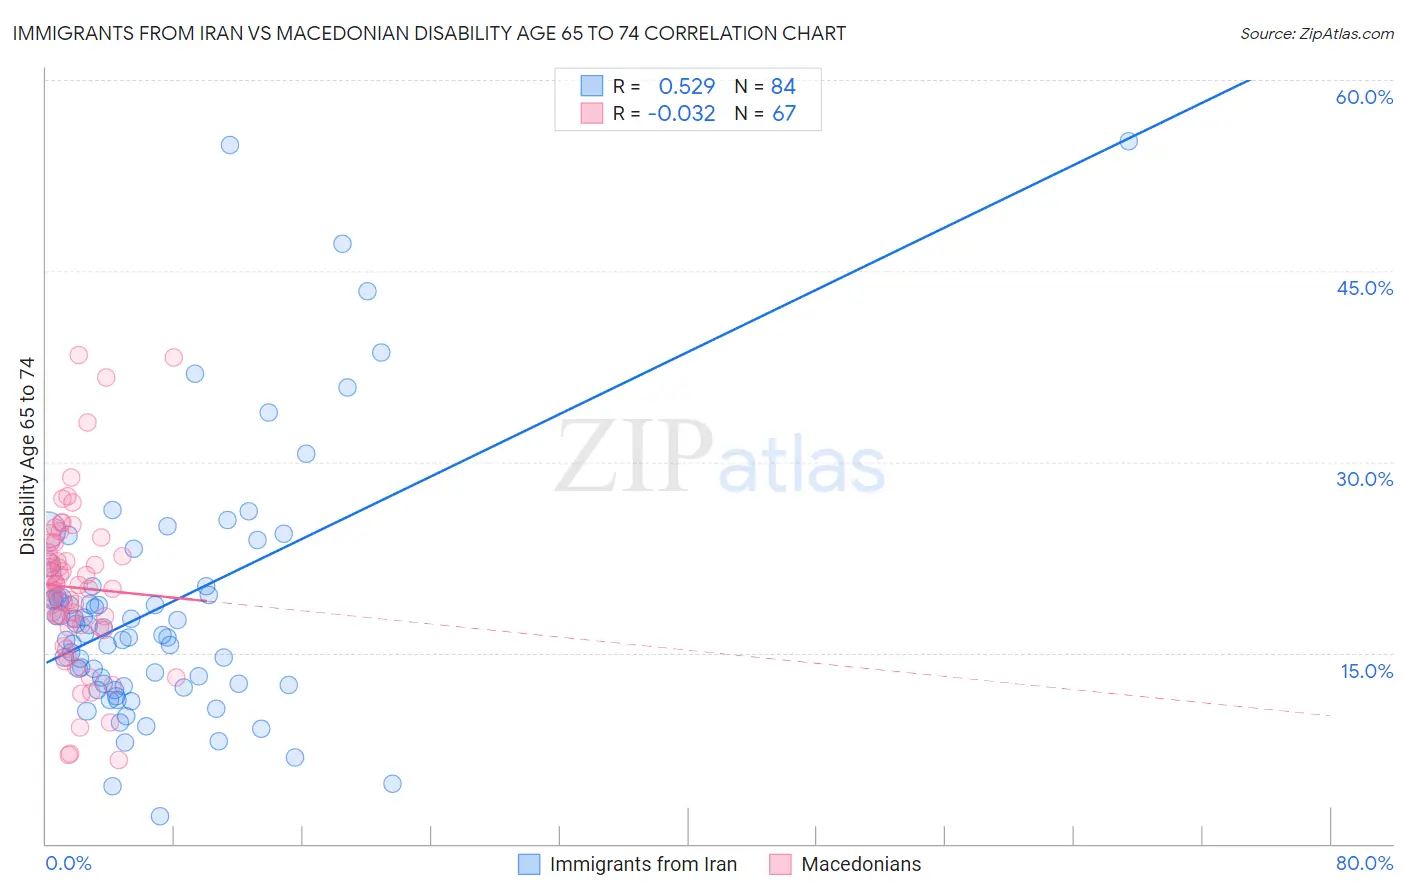
Immigrants from Iran vs Macedonian Disability Age 65 to 74 Correlation Chart
The statistical analysis conducted on geographies consisting of 279,660,502 people shows a substantial positive correlation between the proportion of Immigrants from Iran and percentage of population with a disability between the ages 65 and 75 in the United States with a correlation coefficient (R) of 0.529 and weighted average of 20.9%. Similarly, the statistical analysis conducted on geographies consisting of 132,559,709 people shows no correlation between the proportion of Macedonians and percentage of population with a disability between the ages 65 and 75 in the United States with a correlation coefficient (R) of -0.032 and weighted average of 21.3%, a difference of 2.1%.
Disability Age 65 to 74 Correlation Summary
| Measurement | Immigrants from Iran | Macedonian |
| Minimum | 2.1% | 6.6% |
| Maximum | 55.2% | 38.4% |
| Range | 53.1% | 31.8% |
| Mean | 18.6% | 20.1% |
| Median | 16.7% | 20.3% |
| Interquartile 25% (IQ1) | 12.5% | 17.0% |
| Interquartile 75% (IQ3) | 20.2% | 23.7% |
| Interquartile Range (IQR) | 7.7% | 6.7% |
| Standard Deviation (Sample) | 9.9% | 6.5% |
| Standard Deviation (Population) | 9.8% | 6.5% |
Demographics Similar to Immigrants from Iran and Macedonians by Disability Age 65 to 74
In terms of disability age 65 to 74, the demographic groups most similar to Immigrants from Iran are Immigrants from Belgium (21.0%, a difference of 0.31%), Soviet Union (21.0%, a difference of 0.35%), Bolivian (21.0%, a difference of 0.40%), Immigrants from Australia (21.0%, a difference of 0.42%), and Immigrants from Sweden (21.0%, a difference of 0.43%). Similarly, the demographic groups most similar to Macedonians are Immigrants from Austria (21.2%, a difference of 0.43%), Latvian (21.2%, a difference of 0.50%), Argentinean (21.2%, a difference of 0.66%), Israeli (21.2%, a difference of 0.85%), and Russian (21.2%, a difference of 0.85%).
| Demographics | Rating | Rank | Disability Age 65 to 74 |
| Immigrants | Iran | 99.9 /100 | #22 | Exceptional 20.9% |
| Immigrants | Belgium | 99.9 /100 | #23 | Exceptional 21.0% |
| Soviet Union | 99.9 /100 | #24 | Exceptional 21.0% |
| Bolivians | 99.9 /100 | #25 | Exceptional 21.0% |
| Immigrants | Australia | 99.9 /100 | #26 | Exceptional 21.0% |
| Immigrants | Sweden | 99.9 /100 | #27 | Exceptional 21.0% |
| Immigrants | Czechoslovakia | 99.9 /100 | #28 | Exceptional 21.0% |
| Immigrants | Japan | 99.9 /100 | #29 | Exceptional 21.0% |
| Immigrants | Greece | 99.9 /100 | #30 | Exceptional 21.0% |
| Immigrants | Northern Europe | 99.9 /100 | #31 | Exceptional 21.0% |
| Turks | 99.9 /100 | #32 | Exceptional 21.0% |
| Immigrants | Argentina | 99.9 /100 | #33 | Exceptional 21.1% |
| Immigrants | Sri Lanka | 99.9 /100 | #34 | Exceptional 21.1% |
| Bulgarians | 99.9 /100 | #35 | Exceptional 21.1% |
| Immigrants | Switzerland | 99.8 /100 | #36 | Exceptional 21.1% |
| Israelis | 99.8 /100 | #37 | Exceptional 21.2% |
| Russians | 99.8 /100 | #38 | Exceptional 21.2% |
| Argentineans | 99.8 /100 | #39 | Exceptional 21.2% |
| Latvians | 99.8 /100 | #40 | Exceptional 21.2% |
| Immigrants | Austria | 99.8 /100 | #41 | Exceptional 21.2% |
| Macedonians | 99.7 /100 | #42 | Exceptional 21.3% |