White/Caucasian vs Macedonian Unemployment Among Ages 60 to 64 years
COMPARE
White/Caucasian
Macedonian
Unemployment Among Ages 60 to 64 years
Unemployment Among Ages 60 to 64 years Comparison
Whites/Caucasians
Macedonians
4.7%
UNEMPLOYMENT AMONG AGES 60 TO 64 YEARS
97.8/ 100
METRIC RATING
103rd/ 347
METRIC RANK
4.7%
UNEMPLOYMENT AMONG AGES 60 TO 64 YEARS
95.7/ 100
METRIC RATING
120th/ 347
METRIC RANK
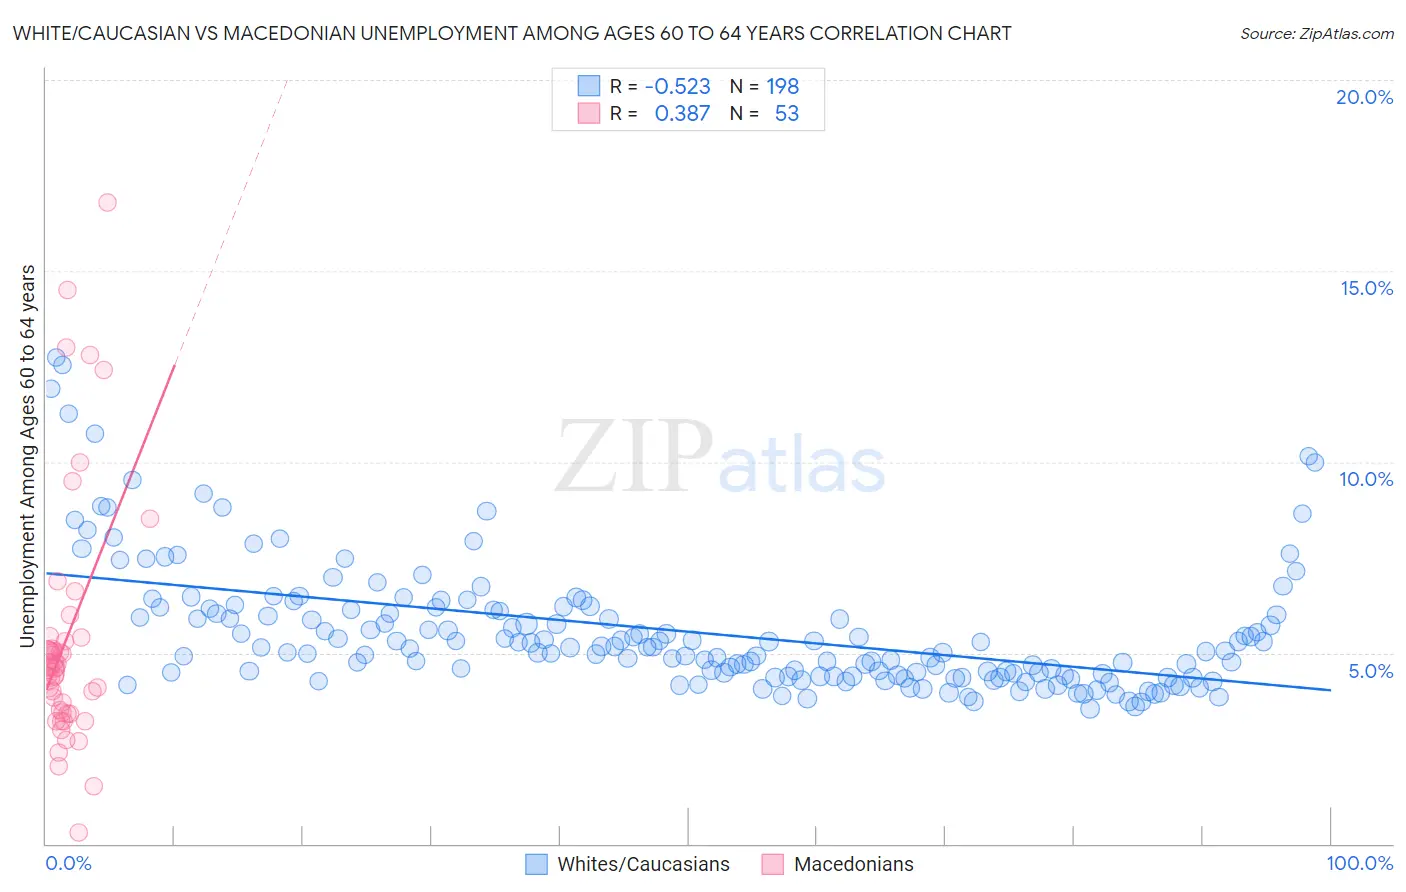
White/Caucasian vs Macedonian Unemployment Among Ages 60 to 64 years Correlation Chart
The statistical analysis conducted on geographies consisting of 469,979,801 people shows a substantial negative correlation between the proportion of Whites/Caucasians and unemployment rate among population between the ages 60 and 64 in the United States with a correlation coefficient (R) of -0.523 and weighted average of 4.7%. Similarly, the statistical analysis conducted on geographies consisting of 126,462,192 people shows a mild positive correlation between the proportion of Macedonians and unemployment rate among population between the ages 60 and 64 in the United States with a correlation coefficient (R) of 0.387 and weighted average of 4.7%, a difference of 0.65%.
Unemployment Among Ages 60 to 64 years Correlation Summary
| Measurement | White/Caucasian | Macedonian |
| Minimum | 3.5% | 0.30% |
| Maximum | 12.7% | 16.8% |
| Range | 9.2% | 16.5% |
| Mean | 5.6% | 5.4% |
| Median | 5.1% | 4.6% |
| Interquartile 25% (IQ1) | 4.4% | 3.4% |
| Interquartile 75% (IQ3) | 6.1% | 5.3% |
| Interquartile Range (IQR) | 1.7% | 1.9% |
| Standard Deviation (Sample) | 1.7% | 3.3% |
| Standard Deviation (Population) | 1.7% | 3.3% |
Demographics Similar to Whites/Caucasians and Macedonians by Unemployment Among Ages 60 to 64 years
In terms of unemployment among ages 60 to 64 years, the demographic groups most similar to Whites/Caucasians are Immigrants from Canada (4.7%, a difference of 0.010%), Malaysian (4.7%, a difference of 0.020%), Paraguayan (4.7%, a difference of 0.040%), Canadian (4.7%, a difference of 0.070%), and Immigrants from North America (4.7%, a difference of 0.10%). Similarly, the demographic groups most similar to Macedonians are Immigrants from Morocco (4.7%, a difference of 0.010%), Albanian (4.7%, a difference of 0.080%), Ukrainian (4.7%, a difference of 0.10%), Immigrants from England (4.7%, a difference of 0.15%), and Immigrants from Germany (4.7%, a difference of 0.15%).
| Demographics | Rating | Rank | Unemployment Among Ages 60 to 64 years |
| Malaysians | 97.9 /100 | #101 | Exceptional 4.7% |
| Immigrants | Canada | 97.8 /100 | #102 | Exceptional 4.7% |
| Whites/Caucasians | 97.8 /100 | #103 | Exceptional 4.7% |
| Paraguayans | 97.7 /100 | #104 | Exceptional 4.7% |
| Canadians | 97.7 /100 | #105 | Exceptional 4.7% |
| Immigrants | North America | 97.6 /100 | #106 | Exceptional 4.7% |
| Greeks | 97.5 /100 | #107 | Exceptional 4.7% |
| Immigrants | Japan | 97.4 /100 | #108 | Exceptional 4.7% |
| Immigrants | Netherlands | 97.4 /100 | #109 | Exceptional 4.7% |
| Ethiopians | 97.2 /100 | #110 | Exceptional 4.7% |
| French | 97.1 /100 | #111 | Exceptional 4.7% |
| Syrians | 97.0 /100 | #112 | Exceptional 4.7% |
| Bulgarians | 96.6 /100 | #113 | Exceptional 4.7% |
| Maltese | 96.5 /100 | #114 | Exceptional 4.7% |
| Immigrants | Romania | 96.4 /100 | #115 | Exceptional 4.7% |
| Immigrants | England | 96.3 /100 | #116 | Exceptional 4.7% |
| Immigrants | Germany | 96.3 /100 | #117 | Exceptional 4.7% |
| Ukrainians | 96.1 /100 | #118 | Exceptional 4.7% |
| Immigrants | Morocco | 95.7 /100 | #119 | Exceptional 4.7% |
| Macedonians | 95.7 /100 | #120 | Exceptional 4.7% |
| Albanians | 95.3 /100 | #121 | Exceptional 4.7% |