White/Caucasian vs Jordanian Female Poverty Among 18-24 Year Olds
COMPARE
White/Caucasian
Jordanian
Female Poverty Among 18-24 Year Olds
Female Poverty Among 18-24 Year Olds Comparison
Whites/Caucasians
Jordanians
20.8%
FEMALE POVERTY AMONG 18-24 YEAR OLDS
6.1/ 100
METRIC RATING
230th/ 347
METRIC RANK
18.6%
FEMALE POVERTY AMONG 18-24 YEAR OLDS
99.8/ 100
METRIC RATING
66th/ 347
METRIC RANK
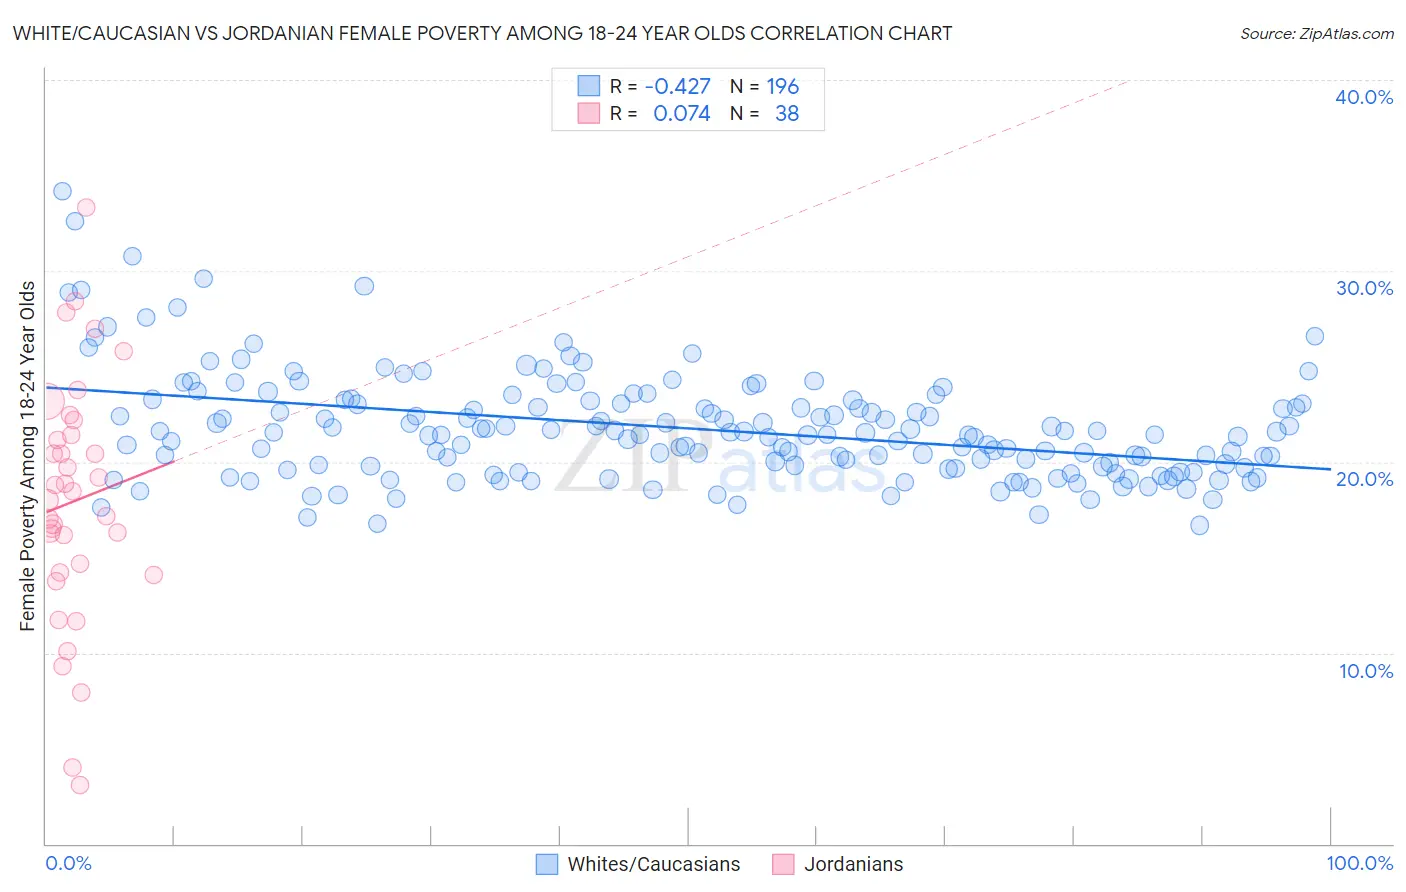
White/Caucasian vs Jordanian Female Poverty Among 18-24 Year Olds Correlation Chart
The statistical analysis conducted on geographies consisting of 545,122,954 people shows a moderate negative correlation between the proportion of Whites/Caucasians and poverty level among females between the ages 18 and 24 in the United States with a correlation coefficient (R) of -0.427 and weighted average of 20.8%. Similarly, the statistical analysis conducted on geographies consisting of 165,137,509 people shows a slight positive correlation between the proportion of Jordanians and poverty level among females between the ages 18 and 24 in the United States with a correlation coefficient (R) of 0.074 and weighted average of 18.6%, a difference of 11.7%.
Female Poverty Among 18-24 Year Olds Correlation Summary
| Measurement | White/Caucasian | Jordanian |
| Minimum | 16.7% | 3.1% |
| Maximum | 34.2% | 33.3% |
| Range | 17.5% | 30.2% |
| Mean | 21.7% | 17.9% |
| Median | 21.4% | 18.2% |
| Interquartile 25% (IQ1) | 19.7% | 14.2% |
| Interquartile 75% (IQ3) | 23.1% | 21.4% |
| Interquartile Range (IQR) | 3.5% | 7.2% |
| Standard Deviation (Sample) | 2.9% | 6.4% |
| Standard Deviation (Population) | 2.8% | 6.4% |
Similar Demographics by Female Poverty Among 18-24 Year Olds
Demographics Similar to Whites/Caucasians by Female Poverty Among 18-24 Year Olds
In terms of female poverty among 18-24 year olds, the demographic groups most similar to Whites/Caucasians are Australian (20.8%, a difference of 0.0%), Immigrants from St. Vincent and the Grenadines (20.8%, a difference of 0.020%), Finnish (20.8%, a difference of 0.030%), Immigrants from Denmark (20.8%, a difference of 0.060%), and Ghanaian (20.8%, a difference of 0.070%).
| Demographics | Rating | Rank | Female Poverty Among 18-24 Year Olds |
| French | 7.9 /100 | #223 | Tragic 20.7% |
| Immigrants | Liberia | 7.6 /100 | #224 | Tragic 20.7% |
| Norwegians | 7.3 /100 | #225 | Tragic 20.7% |
| Estonians | 7.2 /100 | #226 | Tragic 20.7% |
| Immigrants | Sweden | 6.8 /100 | #227 | Tragic 20.7% |
| Ghanaians | 6.5 /100 | #228 | Tragic 20.8% |
| Australians | 6.1 /100 | #229 | Tragic 20.8% |
| Whites/Caucasians | 6.1 /100 | #230 | Tragic 20.8% |
| Immigrants | St. Vincent and the Grenadines | 6.0 /100 | #231 | Tragic 20.8% |
| Finns | 6.0 /100 | #232 | Tragic 20.8% |
| Immigrants | Denmark | 5.8 /100 | #233 | Tragic 20.8% |
| Welsh | 5.4 /100 | #234 | Tragic 20.8% |
| Immigrants | Uganda | 5.1 /100 | #235 | Tragic 20.8% |
| Okinawans | 4.9 /100 | #236 | Tragic 20.8% |
| Scottish | 4.5 /100 | #237 | Tragic 20.9% |
Demographics Similar to Jordanians by Female Poverty Among 18-24 Year Olds
In terms of female poverty among 18-24 year olds, the demographic groups most similar to Jordanians are Immigrants from Scotland (18.6%, a difference of 0.17%), Immigrants from Korea (18.6%, a difference of 0.17%), Immigrants from Asia (18.6%, a difference of 0.20%), Brazilian (18.6%, a difference of 0.21%), and Immigrants from Belarus (18.5%, a difference of 0.23%).
| Demographics | Rating | Rank | Female Poverty Among 18-24 Year Olds |
| Egyptians | 99.9 /100 | #59 | Exceptional 18.5% |
| Immigrants | Brazil | 99.8 /100 | #60 | Exceptional 18.5% |
| Immigrants | Albania | 99.8 /100 | #61 | Exceptional 18.5% |
| Greeks | 99.8 /100 | #62 | Exceptional 18.5% |
| Immigrants | Belarus | 99.8 /100 | #63 | Exceptional 18.5% |
| Immigrants | Asia | 99.8 /100 | #64 | Exceptional 18.6% |
| Immigrants | Scotland | 99.8 /100 | #65 | Exceptional 18.6% |
| Jordanians | 99.8 /100 | #66 | Exceptional 18.6% |
| Immigrants | Korea | 99.8 /100 | #67 | Exceptional 18.6% |
| Brazilians | 99.8 /100 | #68 | Exceptional 18.6% |
| Immigrants | Bulgaria | 99.7 /100 | #69 | Exceptional 18.6% |
| Immigrants | Costa Rica | 99.7 /100 | #70 | Exceptional 18.7% |
| Immigrants | Haiti | 99.7 /100 | #71 | Exceptional 18.7% |
| Armenians | 99.7 /100 | #72 | Exceptional 18.7% |
| Lithuanians | 99.7 /100 | #73 | Exceptional 18.7% |