Ukrainian vs Jordanian Disability Age 65 to 74
COMPARE
Ukrainian
Jordanian
Disability Age 65 to 74
Disability Age 65 to 74 Comparison
Ukrainians
Jordanians
22.3%
DISABILITY AGE 65 TO 74
95.1/ 100
METRIC RATING
114th/ 347
METRIC RANK
22.2%
DISABILITY AGE 65 TO 74
96.9/ 100
METRIC RATING
98th/ 347
METRIC RANK
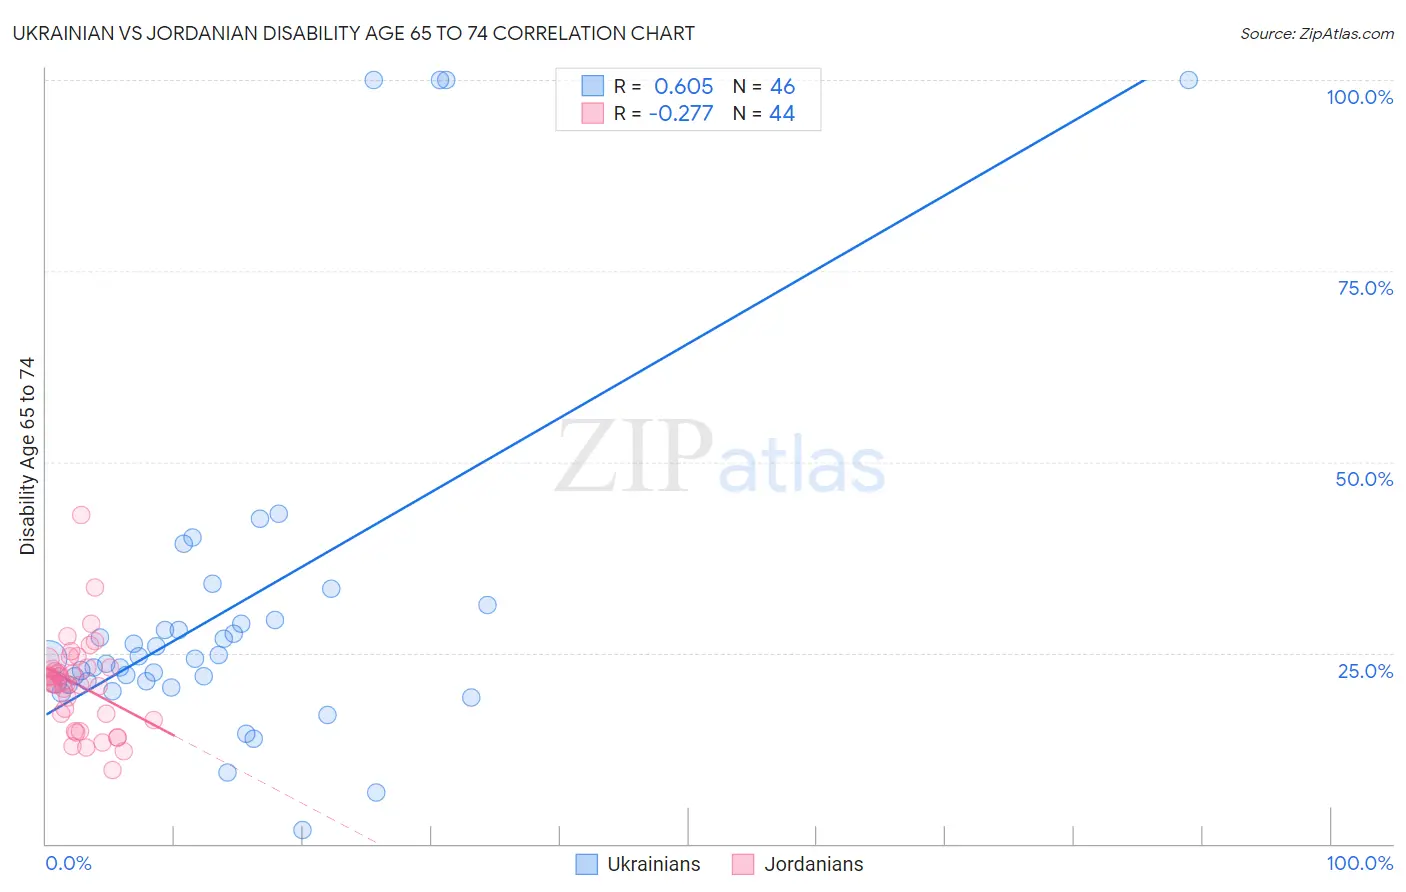
Ukrainian vs Jordanian Disability Age 65 to 74 Correlation Chart
The statistical analysis conducted on geographies consisting of 447,594,992 people shows a significant positive correlation between the proportion of Ukrainians and percentage of population with a disability between the ages 65 and 75 in the United States with a correlation coefficient (R) of 0.605 and weighted average of 22.3%. Similarly, the statistical analysis conducted on geographies consisting of 166,340,353 people shows a weak negative correlation between the proportion of Jordanians and percentage of population with a disability between the ages 65 and 75 in the United States with a correlation coefficient (R) of -0.277 and weighted average of 22.2%, a difference of 0.71%.
Disability Age 65 to 74 Correlation Summary
| Measurement | Ukrainian | Jordanian |
| Minimum | 1.9% | 9.7% |
| Maximum | 100.0% | 43.1% |
| Range | 98.1% | 33.4% |
| Mean | 30.8% | 20.8% |
| Median | 24.2% | 21.0% |
| Interquartile 25% (IQ1) | 21.2% | 16.6% |
| Interquartile 75% (IQ3) | 29.3% | 23.1% |
| Interquartile Range (IQR) | 8.1% | 6.5% |
| Standard Deviation (Sample) | 23.1% | 6.0% |
| Standard Deviation (Population) | 22.8% | 6.0% |
Demographics Similar to Ukrainians and Jordanians by Disability Age 65 to 74
In terms of disability age 65 to 74, the demographic groups most similar to Ukrainians are Laotian (22.3%, a difference of 0.060%), Syrian (22.3%, a difference of 0.080%), Brazilian (22.4%, a difference of 0.10%), Immigrants from South America (22.3%, a difference of 0.14%), and Serbian (22.3%, a difference of 0.20%). Similarly, the demographic groups most similar to Jordanians are Immigrants from Colombia (22.2%, a difference of 0.030%), Uruguayan (22.2%, a difference of 0.16%), Immigrants from England (22.2%, a difference of 0.17%), Immigrants from Saudi Arabia (22.2%, a difference of 0.20%), and Immigrants from Southern Europe (22.1%, a difference of 0.21%).
| Demographics | Rating | Rank | Disability Age 65 to 74 |
| Immigrants | North America | 97.5 /100 | #96 | Exceptional 22.1% |
| Immigrants | Southern Europe | 97.2 /100 | #97 | Exceptional 22.1% |
| Jordanians | 96.9 /100 | #98 | Exceptional 22.2% |
| Immigrants | Colombia | 96.8 /100 | #99 | Exceptional 22.2% |
| Uruguayans | 96.5 /100 | #100 | Exceptional 22.2% |
| Immigrants | England | 96.5 /100 | #101 | Exceptional 22.2% |
| Immigrants | Saudi Arabia | 96.4 /100 | #102 | Exceptional 22.2% |
| South Americans | 96.4 /100 | #103 | Exceptional 22.2% |
| Colombians | 96.4 /100 | #104 | Exceptional 22.2% |
| Palestinians | 96.3 /100 | #105 | Exceptional 22.2% |
| Peruvians | 96.1 /100 | #106 | Exceptional 22.2% |
| Slovenes | 96.1 /100 | #107 | Exceptional 22.2% |
| Immigrants | Zimbabwe | 96.1 /100 | #108 | Exceptional 22.3% |
| Albanians | 95.8 /100 | #109 | Exceptional 22.3% |
| Immigrants | Peru | 95.7 /100 | #110 | Exceptional 22.3% |
| Serbians | 95.7 /100 | #111 | Exceptional 22.3% |
| Immigrants | South America | 95.5 /100 | #112 | Exceptional 22.3% |
| Syrians | 95.3 /100 | #113 | Exceptional 22.3% |
| Ukrainians | 95.1 /100 | #114 | Exceptional 22.3% |
| Laotians | 94.9 /100 | #115 | Exceptional 22.3% |
| Brazilians | 94.8 /100 | #116 | Exceptional 22.4% |