Immigrants from Trinidad and Tobago vs Immigrants from Indonesia Vision Disability
COMPARE
Immigrants from Trinidad and Tobago
Immigrants from Indonesia
Vision Disability
Vision Disability Comparison
Immigrants from Trinidad and Tobago
Immigrants from Indonesia
2.3%
VISION DISABILITY
6.1/ 100
METRIC RATING
216th/ 347
METRIC RANK
2.0%
VISION DISABILITY
99.7/ 100
METRIC RATING
44th/ 347
METRIC RANK
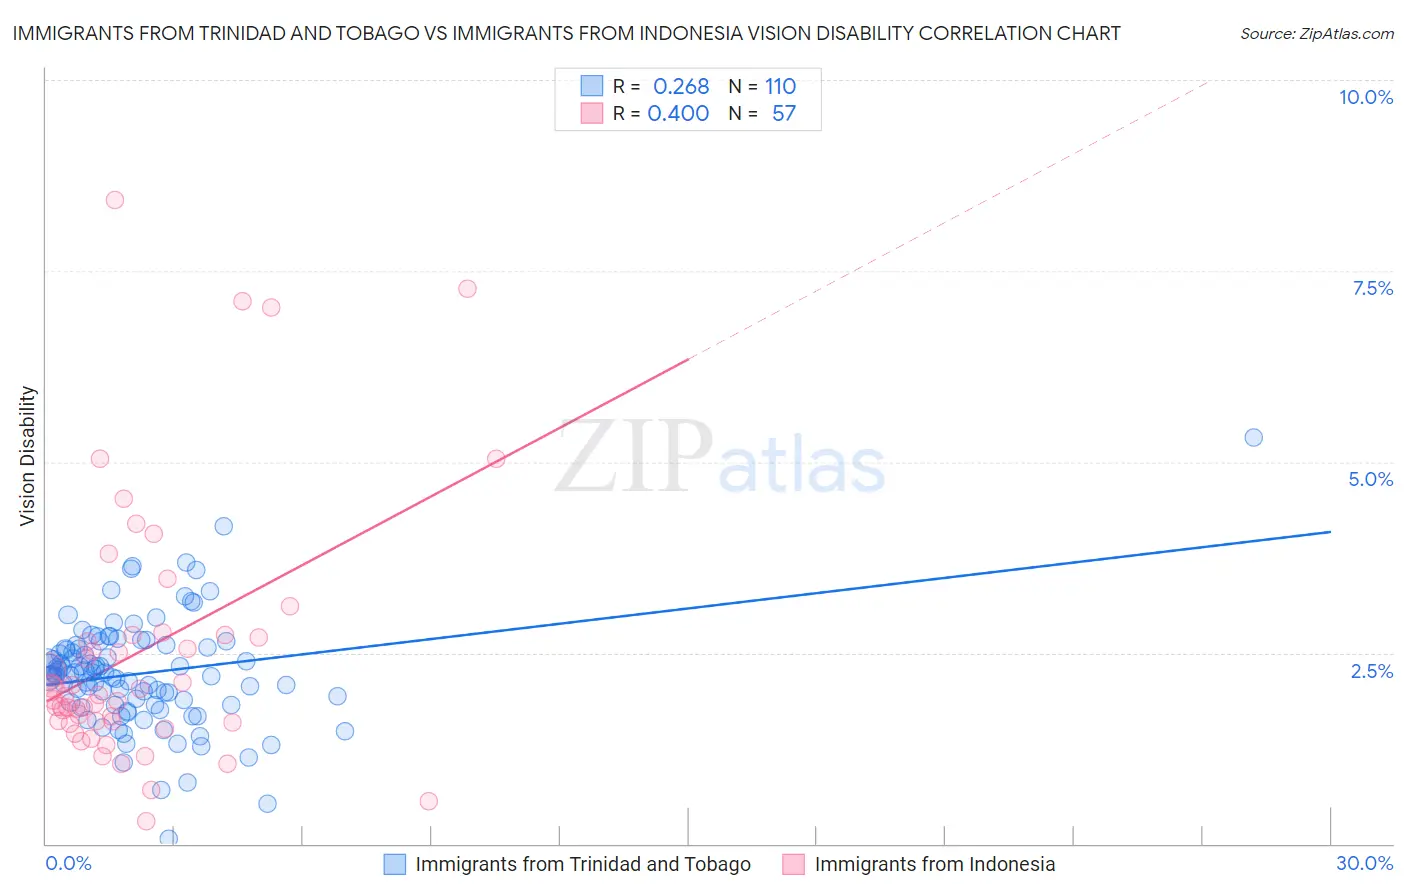
Immigrants from Trinidad and Tobago vs Immigrants from Indonesia Vision Disability Correlation Chart
The statistical analysis conducted on geographies consisting of 223,458,050 people shows a weak positive correlation between the proportion of Immigrants from Trinidad and Tobago and percentage of population with vision disability in the United States with a correlation coefficient (R) of 0.268 and weighted average of 2.3%. Similarly, the statistical analysis conducted on geographies consisting of 215,759,467 people shows a moderate positive correlation between the proportion of Immigrants from Indonesia and percentage of population with vision disability in the United States with a correlation coefficient (R) of 0.400 and weighted average of 2.0%, a difference of 14.6%.
Vision Disability Correlation Summary
| Measurement | Immigrants from Trinidad and Tobago | Immigrants from Indonesia |
| Minimum | 0.061% | 0.29% |
| Maximum | 5.3% | 8.4% |
| Range | 5.3% | 8.1% |
| Mean | 2.2% | 2.5% |
| Median | 2.2% | 1.9% |
| Interquartile 25% (IQ1) | 1.8% | 1.6% |
| Interquartile 75% (IQ3) | 2.6% | 2.7% |
| Interquartile Range (IQR) | 0.74% | 1.1% |
| Standard Deviation (Sample) | 0.72% | 1.7% |
| Standard Deviation (Population) | 0.72% | 1.7% |
Similar Demographics by Vision Disability
Demographics Similar to Immigrants from Trinidad and Tobago by Vision Disability
In terms of vision disability, the demographic groups most similar to Immigrants from Trinidad and Tobago are Barbadian (2.3%, a difference of 0.28%), Nigerian (2.3%, a difference of 0.29%), Portuguese (2.3%, a difference of 0.34%), Ecuadorian (2.3%, a difference of 0.45%), and Trinidadian and Tobagonian (2.2%, a difference of 0.50%).
| Demographics | Rating | Rank | Vision Disability |
| Immigrants | Brazil | 13.1 /100 | #209 | Poor 2.2% |
| Immigrants | Uruguay | 11.5 /100 | #210 | Poor 2.2% |
| Indonesians | 9.5 /100 | #211 | Tragic 2.2% |
| Bermudans | 9.0 /100 | #212 | Tragic 2.2% |
| Immigrants | Ghana | 8.9 /100 | #213 | Tragic 2.2% |
| Trinidadians and Tobagonians | 8.2 /100 | #214 | Tragic 2.2% |
| Nigerians | 7.2 /100 | #215 | Tragic 2.3% |
| Immigrants | Trinidad and Tobago | 6.1 /100 | #216 | Tragic 2.3% |
| Barbadians | 5.1 /100 | #217 | Tragic 2.3% |
| Portuguese | 4.9 /100 | #218 | Tragic 2.3% |
| Ecuadorians | 4.6 /100 | #219 | Tragic 2.3% |
| Guamanians/Chamorros | 3.9 /100 | #220 | Tragic 2.3% |
| French Canadians | 3.9 /100 | #221 | Tragic 2.3% |
| Immigrants | Senegal | 3.8 /100 | #222 | Tragic 2.3% |
| Basques | 3.5 /100 | #223 | Tragic 2.3% |
Demographics Similar to Immigrants from Indonesia by Vision Disability
In terms of vision disability, the demographic groups most similar to Immigrants from Indonesia are Eastern European (2.0%, a difference of 0.020%), Ethiopian (2.0%, a difference of 0.030%), Immigrants from Sweden (2.0%, a difference of 0.070%), Immigrants from Ethiopia (2.0%, a difference of 0.090%), and Immigrants from Bulgaria (2.0%, a difference of 0.090%).
| Demographics | Rating | Rank | Vision Disability |
| Bhutanese | 99.8 /100 | #37 | Exceptional 2.0% |
| Immigrants | Kuwait | 99.8 /100 | #38 | Exceptional 2.0% |
| Zimbabweans | 99.7 /100 | #39 | Exceptional 2.0% |
| Immigrants | Ireland | 99.7 /100 | #40 | Exceptional 2.0% |
| Cypriots | 99.7 /100 | #41 | Exceptional 2.0% |
| Immigrants | Ethiopia | 99.7 /100 | #42 | Exceptional 2.0% |
| Eastern Europeans | 99.7 /100 | #43 | Exceptional 2.0% |
| Immigrants | Indonesia | 99.7 /100 | #44 | Exceptional 2.0% |
| Ethiopians | 99.7 /100 | #45 | Exceptional 2.0% |
| Immigrants | Sweden | 99.7 /100 | #46 | Exceptional 2.0% |
| Immigrants | Bulgaria | 99.7 /100 | #47 | Exceptional 2.0% |
| Israelis | 99.6 /100 | #48 | Exceptional 2.0% |
| Latvians | 99.5 /100 | #49 | Exceptional 2.0% |
| Afghans | 99.5 /100 | #50 | Exceptional 2.0% |
| Tongans | 99.5 /100 | #51 | Exceptional 2.0% |