Honduran vs Immigrants from Colombia Female Disability
COMPARE
Honduran
Immigrants from Colombia
Female Disability
Female Disability Comparison
Hondurans
Immigrants from Colombia
12.3%
FEMALE DISABILITY
25.4/ 100
METRIC RATING
197th/ 347
METRIC RANK
11.4%
FEMALE DISABILITY
99.9/ 100
METRIC RATING
63rd/ 347
METRIC RANK
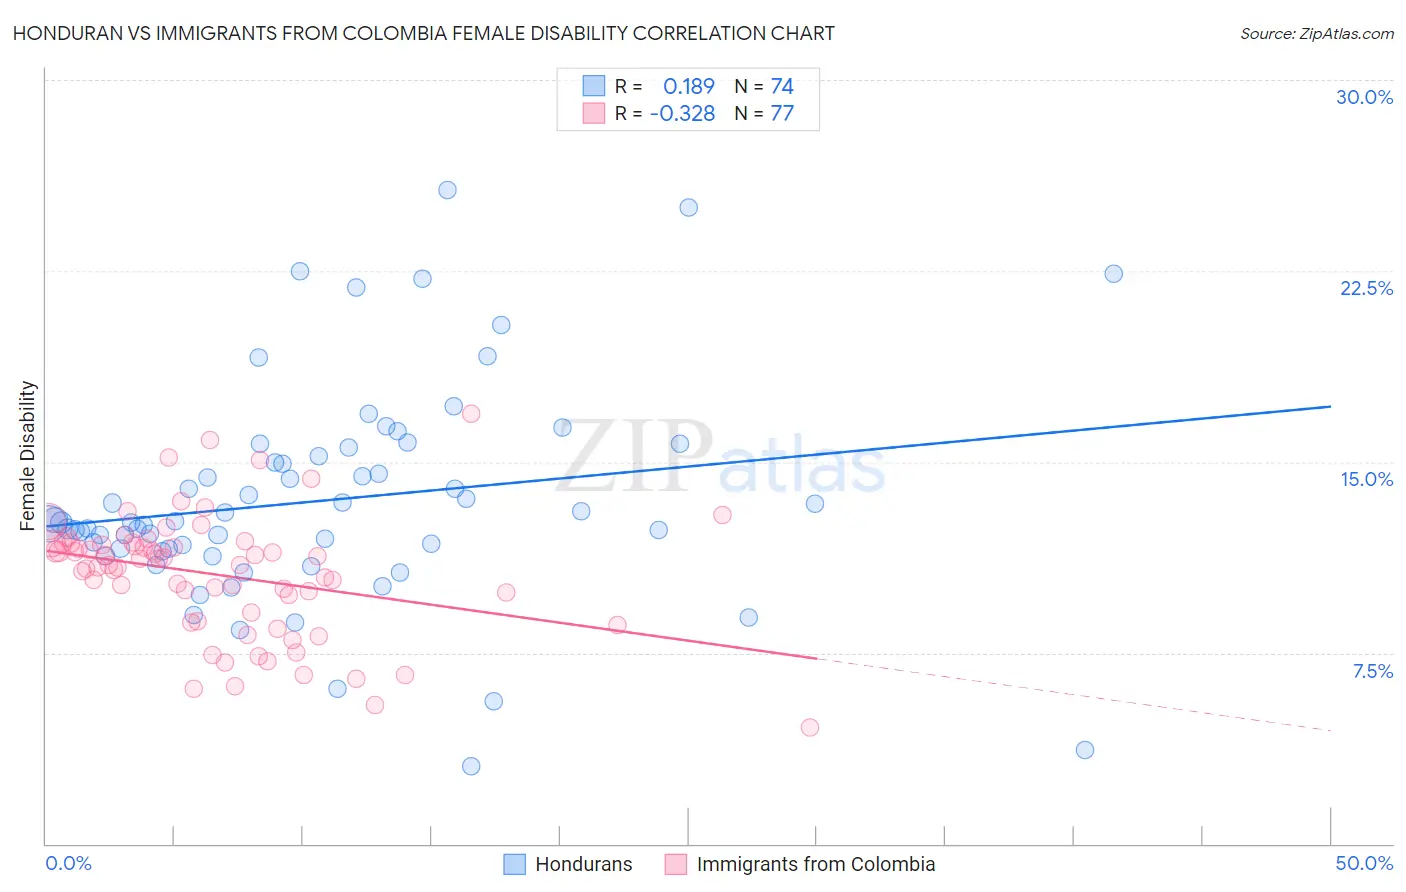
Honduran vs Immigrants from Colombia Female Disability Correlation Chart
The statistical analysis conducted on geographies consisting of 357,759,826 people shows a poor positive correlation between the proportion of Hondurans and percentage of females with a disability in the United States with a correlation coefficient (R) of 0.189 and weighted average of 12.3%. Similarly, the statistical analysis conducted on geographies consisting of 378,634,617 people shows a mild negative correlation between the proportion of Immigrants from Colombia and percentage of females with a disability in the United States with a correlation coefficient (R) of -0.328 and weighted average of 11.4%, a difference of 7.8%.
Female Disability Correlation Summary
| Measurement | Honduran | Immigrants from Colombia |
| Minimum | 3.1% | 4.6% |
| Maximum | 25.7% | 16.9% |
| Range | 22.6% | 12.3% |
| Mean | 13.5% | 10.6% |
| Median | 12.6% | 11.0% |
| Interquartile 25% (IQ1) | 11.6% | 8.9% |
| Interquartile 75% (IQ3) | 15.2% | 11.8% |
| Interquartile Range (IQR) | 3.6% | 2.9% |
| Standard Deviation (Sample) | 4.2% | 2.4% |
| Standard Deviation (Population) | 4.2% | 2.4% |
Similar Demographics by Female Disability
Demographics Similar to Hondurans by Female Disability
In terms of female disability, the demographic groups most similar to Hondurans are Immigrants from Panama (12.3%, a difference of 0.0%), Mexican American Indian (12.3%, a difference of 0.030%), Immigrants from Trinidad and Tobago (12.3%, a difference of 0.040%), Swedish (12.3%, a difference of 0.060%), and Ukrainian (12.3%, a difference of 0.080%).
| Demographics | Rating | Rank | Female Disability |
| Immigrants | Honduras | 31.3 /100 | #190 | Fair 12.3% |
| Armenians | 29.7 /100 | #191 | Fair 12.3% |
| Immigrants | Western Africa | 29.2 /100 | #192 | Fair 12.3% |
| Northern Europeans | 27.5 /100 | #193 | Fair 12.3% |
| Ukrainians | 27.2 /100 | #194 | Fair 12.3% |
| Swedes | 26.6 /100 | #195 | Fair 12.3% |
| Immigrants | Panama | 25.5 /100 | #196 | Fair 12.3% |
| Hondurans | 25.4 /100 | #197 | Fair 12.3% |
| Mexican American Indians | 24.9 /100 | #198 | Fair 12.3% |
| Immigrants | Trinidad and Tobago | 24.7 /100 | #199 | Fair 12.3% |
| Trinidadians and Tobagonians | 22.4 /100 | #200 | Fair 12.3% |
| Chinese | 22.1 /100 | #201 | Fair 12.3% |
| Somalis | 21.5 /100 | #202 | Fair 12.3% |
| Immigrants | Barbados | 21.1 /100 | #203 | Fair 12.3% |
| Immigrants | Zaire | 20.9 /100 | #204 | Fair 12.3% |
Demographics Similar to Immigrants from Colombia by Female Disability
In terms of female disability, the demographic groups most similar to Immigrants from Colombia are Immigrants from El Salvador (11.4%, a difference of 0.070%), Immigrants from South America (11.4%, a difference of 0.090%), Sri Lankan (11.4%, a difference of 0.10%), Immigrants from France (11.4%, a difference of 0.20%), and Immigrants from Bulgaria (11.4%, a difference of 0.26%).
| Demographics | Rating | Rank | Female Disability |
| Taiwanese | 99.9 /100 | #56 | Exceptional 11.4% |
| South Americans | 99.9 /100 | #57 | Exceptional 11.4% |
| Laotians | 99.9 /100 | #58 | Exceptional 11.4% |
| Immigrants | Spain | 99.9 /100 | #59 | Exceptional 11.4% |
| Immigrants | Bulgaria | 99.9 /100 | #60 | Exceptional 11.4% |
| Immigrants | France | 99.9 /100 | #61 | Exceptional 11.4% |
| Sri Lankans | 99.9 /100 | #62 | Exceptional 11.4% |
| Immigrants | Colombia | 99.9 /100 | #63 | Exceptional 11.4% |
| Immigrants | El Salvador | 99.9 /100 | #64 | Exceptional 11.4% |
| Immigrants | South America | 99.9 /100 | #65 | Exceptional 11.4% |
| Salvadorans | 99.8 /100 | #66 | Exceptional 11.5% |
| Immigrants | Vietnam | 99.8 /100 | #67 | Exceptional 11.5% |
| Immigrants | Northern Africa | 99.8 /100 | #68 | Exceptional 11.5% |
| Colombians | 99.8 /100 | #69 | Exceptional 11.5% |
| Immigrants | Chile | 99.8 /100 | #70 | Exceptional 11.5% |