Immigrants from Uganda vs Immigrants from Colombia Female Disability
COMPARE
Immigrants from Uganda
Immigrants from Colombia
Female Disability
Female Disability Comparison
Immigrants from Uganda
Immigrants from Colombia
11.8%
FEMALE DISABILITY
97.2/ 100
METRIC RATING
119th/ 347
METRIC RANK
11.4%
FEMALE DISABILITY
99.9/ 100
METRIC RATING
63rd/ 347
METRIC RANK
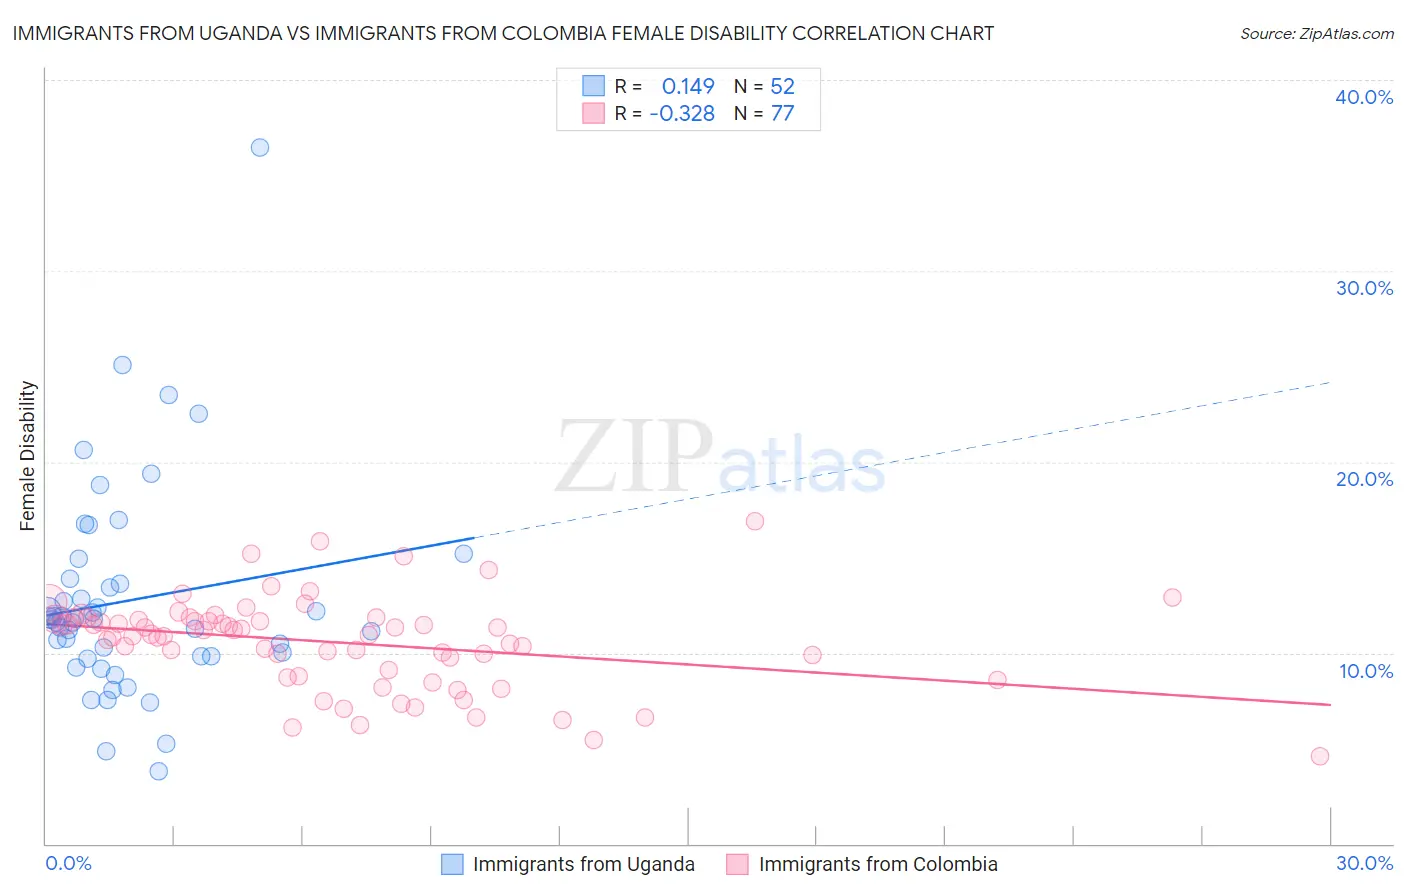
Immigrants from Uganda vs Immigrants from Colombia Female Disability Correlation Chart
The statistical analysis conducted on geographies consisting of 125,980,314 people shows a poor positive correlation between the proportion of Immigrants from Uganda and percentage of females with a disability in the United States with a correlation coefficient (R) of 0.149 and weighted average of 11.8%. Similarly, the statistical analysis conducted on geographies consisting of 378,634,617 people shows a mild negative correlation between the proportion of Immigrants from Colombia and percentage of females with a disability in the United States with a correlation coefficient (R) of -0.328 and weighted average of 11.4%, a difference of 3.1%.
Female Disability Correlation Summary
| Measurement | Immigrants from Uganda | Immigrants from Colombia |
| Minimum | 3.8% | 4.6% |
| Maximum | 36.5% | 16.9% |
| Range | 32.6% | 12.3% |
| Mean | 12.7% | 10.6% |
| Median | 11.8% | 11.0% |
| Interquartile 25% (IQ1) | 9.8% | 8.9% |
| Interquartile 75% (IQ3) | 13.7% | 11.8% |
| Interquartile Range (IQR) | 3.9% | 2.9% |
| Standard Deviation (Sample) | 5.5% | 2.4% |
| Standard Deviation (Population) | 5.5% | 2.4% |
Similar Demographics by Female Disability
Demographics Similar to Immigrants from Uganda by Female Disability
In terms of female disability, the demographic groups most similar to Immigrants from Uganda are Immigrants from Eastern Europe (11.8%, a difference of 0.010%), Immigrants from Nigeria (11.8%, a difference of 0.010%), Immigrants from Kazakhstan (11.8%, a difference of 0.080%), Immigrants from Netherlands (11.8%, a difference of 0.11%), and Immigrants from North Macedonia (11.8%, a difference of 0.12%).
| Demographics | Rating | Rank | Female Disability |
| Immigrants | Bangladesh | 97.8 /100 | #112 | Exceptional 11.8% |
| Immigrants | Belarus | 97.8 /100 | #113 | Exceptional 11.8% |
| South Africans | 97.7 /100 | #114 | Exceptional 11.8% |
| Brazilians | 97.7 /100 | #115 | Exceptional 11.8% |
| Immigrants | Morocco | 97.6 /100 | #116 | Exceptional 11.8% |
| Immigrants | Eastern Europe | 97.2 /100 | #117 | Exceptional 11.8% |
| Immigrants | Nigeria | 97.2 /100 | #118 | Exceptional 11.8% |
| Immigrants | Uganda | 97.2 /100 | #119 | Exceptional 11.8% |
| Immigrants | Kazakhstan | 97.0 /100 | #120 | Exceptional 11.8% |
| Immigrants | Netherlands | 96.9 /100 | #121 | Exceptional 11.8% |
| Immigrants | North Macedonia | 96.8 /100 | #122 | Exceptional 11.8% |
| Immigrants | Croatia | 96.7 /100 | #123 | Exceptional 11.8% |
| Russians | 96.5 /100 | #124 | Exceptional 11.8% |
| Immigrants | Italy | 96.4 /100 | #125 | Exceptional 11.8% |
| Immigrants | Europe | 96.2 /100 | #126 | Exceptional 11.8% |
Demographics Similar to Immigrants from Colombia by Female Disability
In terms of female disability, the demographic groups most similar to Immigrants from Colombia are Immigrants from El Salvador (11.4%, a difference of 0.070%), Immigrants from South America (11.4%, a difference of 0.090%), Sri Lankan (11.4%, a difference of 0.10%), Immigrants from France (11.4%, a difference of 0.20%), and Immigrants from Bulgaria (11.4%, a difference of 0.26%).
| Demographics | Rating | Rank | Female Disability |
| Taiwanese | 99.9 /100 | #56 | Exceptional 11.4% |
| South Americans | 99.9 /100 | #57 | Exceptional 11.4% |
| Laotians | 99.9 /100 | #58 | Exceptional 11.4% |
| Immigrants | Spain | 99.9 /100 | #59 | Exceptional 11.4% |
| Immigrants | Bulgaria | 99.9 /100 | #60 | Exceptional 11.4% |
| Immigrants | France | 99.9 /100 | #61 | Exceptional 11.4% |
| Sri Lankans | 99.9 /100 | #62 | Exceptional 11.4% |
| Immigrants | Colombia | 99.9 /100 | #63 | Exceptional 11.4% |
| Immigrants | El Salvador | 99.9 /100 | #64 | Exceptional 11.4% |
| Immigrants | South America | 99.9 /100 | #65 | Exceptional 11.4% |
| Salvadorans | 99.8 /100 | #66 | Exceptional 11.5% |
| Immigrants | Vietnam | 99.8 /100 | #67 | Exceptional 11.5% |
| Immigrants | Northern Africa | 99.8 /100 | #68 | Exceptional 11.5% |
| Colombians | 99.8 /100 | #69 | Exceptional 11.5% |
| Immigrants | Chile | 99.8 /100 | #70 | Exceptional 11.5% |