Yugoslavian vs Immigrants from Colombia Female Disability
COMPARE
Yugoslavian
Immigrants from Colombia
Female Disability
Female Disability Comparison
Yugoslavians
Immigrants from Colombia
12.6%
FEMALE DISABILITY
3.7/ 100
METRIC RATING
238th/ 347
METRIC RANK
11.4%
FEMALE DISABILITY
99.9/ 100
METRIC RATING
63rd/ 347
METRIC RANK
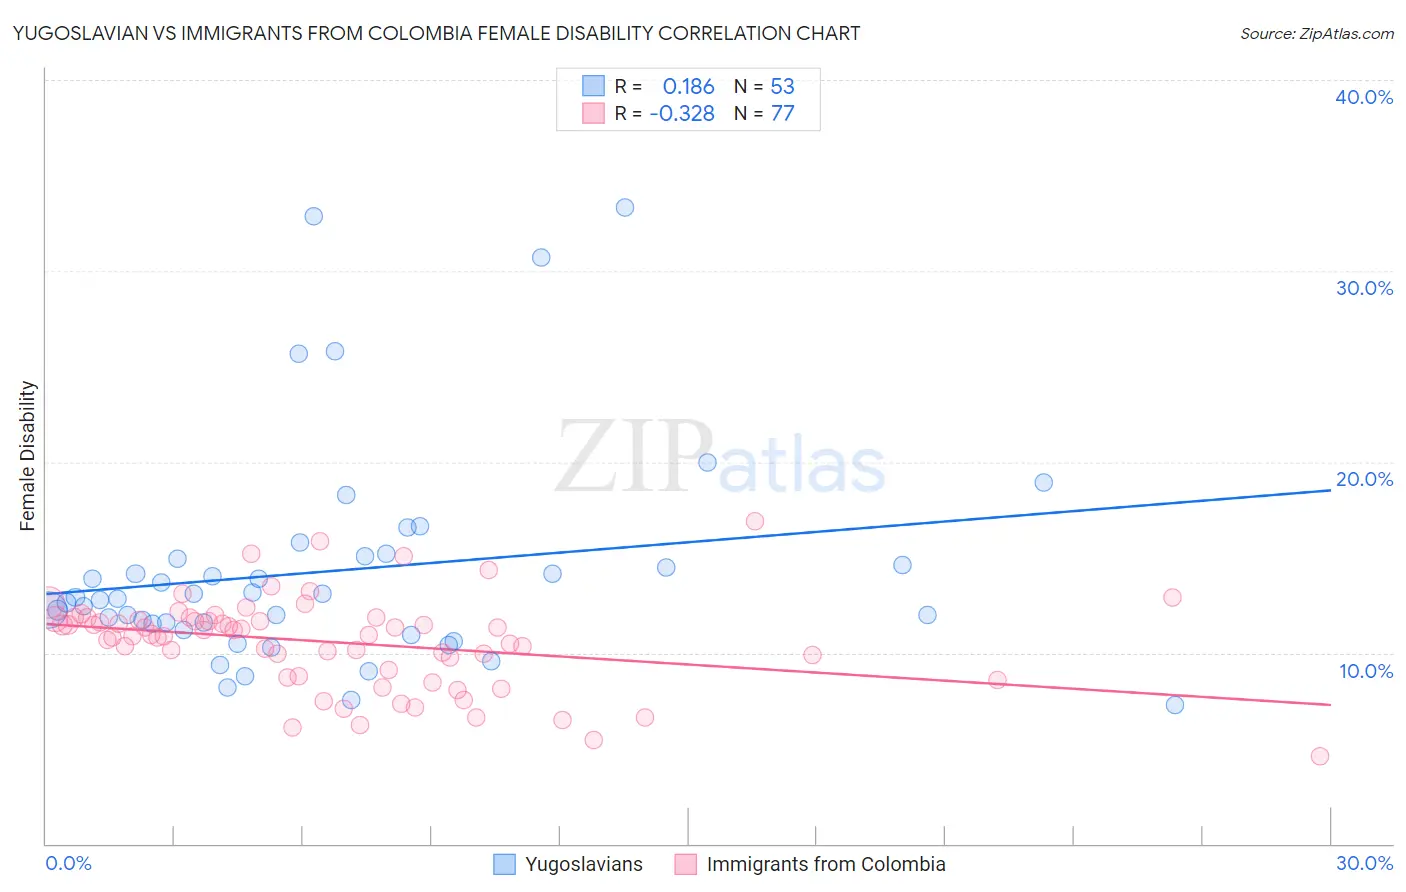
Yugoslavian vs Immigrants from Colombia Female Disability Correlation Chart
The statistical analysis conducted on geographies consisting of 285,691,291 people shows a poor positive correlation between the proportion of Yugoslavians and percentage of females with a disability in the United States with a correlation coefficient (R) of 0.186 and weighted average of 12.6%. Similarly, the statistical analysis conducted on geographies consisting of 378,634,617 people shows a mild negative correlation between the proportion of Immigrants from Colombia and percentage of females with a disability in the United States with a correlation coefficient (R) of -0.328 and weighted average of 11.4%, a difference of 10.0%.
Female Disability Correlation Summary
| Measurement | Yugoslavian | Immigrants from Colombia |
| Minimum | 7.3% | 4.6% |
| Maximum | 33.3% | 16.9% |
| Range | 26.1% | 12.3% |
| Mean | 14.3% | 10.6% |
| Median | 12.9% | 11.0% |
| Interquartile 25% (IQ1) | 11.4% | 8.9% |
| Interquartile 75% (IQ3) | 15.0% | 11.8% |
| Interquartile Range (IQR) | 3.6% | 2.9% |
| Standard Deviation (Sample) | 5.7% | 2.4% |
| Standard Deviation (Population) | 5.7% | 2.4% |
Similar Demographics by Female Disability
Demographics Similar to Yugoslavians by Female Disability
In terms of female disability, the demographic groups most similar to Yugoslavians are Slavic (12.6%, a difference of 0.030%), Barbadian (12.6%, a difference of 0.030%), German Russian (12.6%, a difference of 0.13%), Immigrants from West Indies (12.6%, a difference of 0.15%), and Malaysian (12.5%, a difference of 0.28%).
| Demographics | Rating | Rank | Female Disability |
| Belgians | 6.5 /100 | #231 | Tragic 12.5% |
| Immigrants | Somalia | 5.9 /100 | #232 | Tragic 12.5% |
| Immigrants | Iraq | 5.3 /100 | #233 | Tragic 12.5% |
| Scandinavians | 5.3 /100 | #234 | Tragic 12.5% |
| Malaysians | 5.0 /100 | #235 | Tragic 12.5% |
| Immigrants | West Indies | 4.4 /100 | #236 | Tragic 12.6% |
| Slavs | 3.8 /100 | #237 | Tragic 12.6% |
| Yugoslavians | 3.7 /100 | #238 | Tragic 12.6% |
| Barbadians | 3.6 /100 | #239 | Tragic 12.6% |
| German Russians | 3.2 /100 | #240 | Tragic 12.6% |
| Japanese | 2.7 /100 | #241 | Tragic 12.6% |
| Canadians | 2.6 /100 | #242 | Tragic 12.6% |
| Immigrants | Senegal | 2.5 /100 | #243 | Tragic 12.6% |
| Alsatians | 2.5 /100 | #244 | Tragic 12.6% |
| Immigrants | Jamaica | 2.2 /100 | #245 | Tragic 12.6% |
Demographics Similar to Immigrants from Colombia by Female Disability
In terms of female disability, the demographic groups most similar to Immigrants from Colombia are Immigrants from El Salvador (11.4%, a difference of 0.070%), Immigrants from South America (11.4%, a difference of 0.090%), Sri Lankan (11.4%, a difference of 0.10%), Immigrants from France (11.4%, a difference of 0.20%), and Immigrants from Bulgaria (11.4%, a difference of 0.26%).
| Demographics | Rating | Rank | Female Disability |
| Taiwanese | 99.9 /100 | #56 | Exceptional 11.4% |
| South Americans | 99.9 /100 | #57 | Exceptional 11.4% |
| Laotians | 99.9 /100 | #58 | Exceptional 11.4% |
| Immigrants | Spain | 99.9 /100 | #59 | Exceptional 11.4% |
| Immigrants | Bulgaria | 99.9 /100 | #60 | Exceptional 11.4% |
| Immigrants | France | 99.9 /100 | #61 | Exceptional 11.4% |
| Sri Lankans | 99.9 /100 | #62 | Exceptional 11.4% |
| Immigrants | Colombia | 99.9 /100 | #63 | Exceptional 11.4% |
| Immigrants | El Salvador | 99.9 /100 | #64 | Exceptional 11.4% |
| Immigrants | South America | 99.9 /100 | #65 | Exceptional 11.4% |
| Salvadorans | 99.8 /100 | #66 | Exceptional 11.5% |
| Immigrants | Vietnam | 99.8 /100 | #67 | Exceptional 11.5% |
| Immigrants | Northern Africa | 99.8 /100 | #68 | Exceptional 11.5% |
| Colombians | 99.8 /100 | #69 | Exceptional 11.5% |
| Immigrants | Chile | 99.8 /100 | #70 | Exceptional 11.5% |